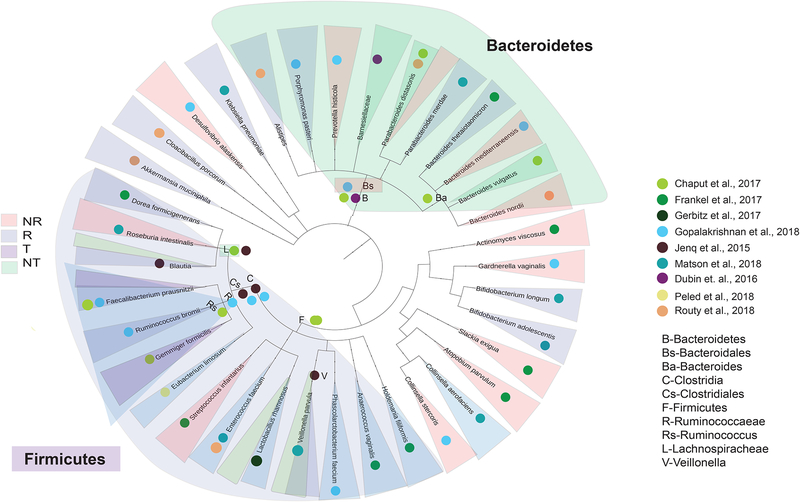
Figure 2. Phylogenetic tree summarizing previously established links between the gut microbiome, treatment outcomes and toxicities in cancer patient populations.
A phylogenetic tree was constructed using evolutionary distances with the phyloT software (Letunic and Bork, 2016), to depict phylogenetic similarity (or lack thereof), of all bacterial taxa reported to be associated with response or toxicity to immune checkpoint blockade in human studies, moving from broader (kingdom) to more specific (species) taxonomies from inside-out. Bacterial taxa are labeled according to publication (colored dots) of origin and shaded (R=treatment response, light blue; NR=treatment non-response, light red; T=toxicity, light green; NT=non-toxicity, light purple) according to the phenotype(s) of association in the various studies included

