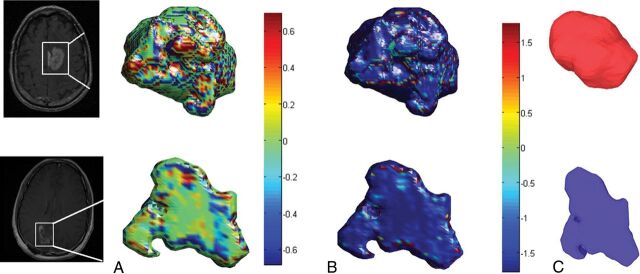
Fig 1.
Color maps visualizing the significant local features on an enhancing lesion region for a TP case (upper row) and a PsP case (lower row). The KT measure is shown in A, whereas the S measure is shown in B. C, Surface-rendering for the 2 cases shows the compactness global feature that was discriminative by the classifier. The PsP mass is more elliptic, whereas the tumor appears to be more compact.

