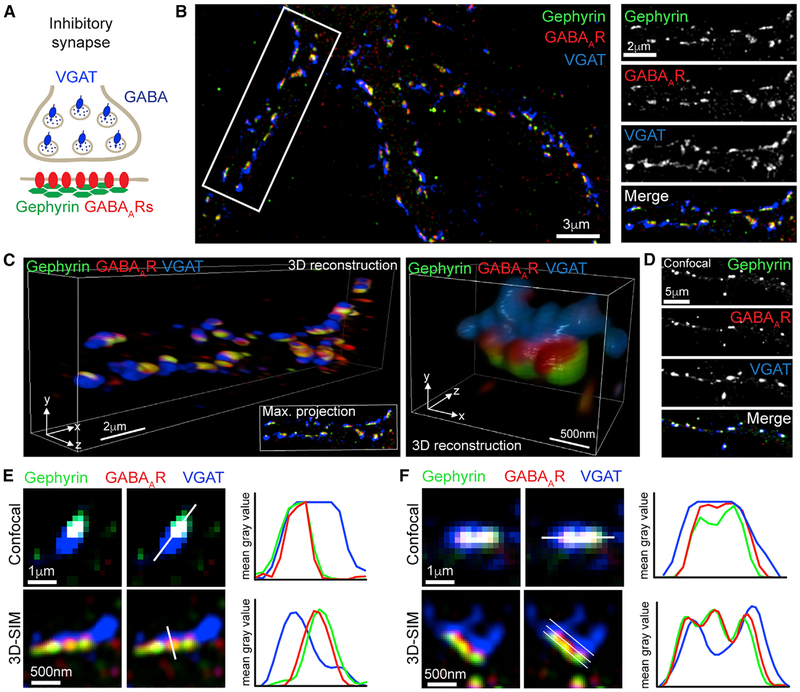
Figure 1. 3D-SIM of Inhibitory Synapses.
(A) Schematic of the inhibitory synapse showing that synaptic GABAARs are anchored by gephyrin opposite GABAergic terminals labeled with VGAT.
(B) Three-dimensional structured illumination microscopy (3D-SIM) maximum projection of hippocampal neuron labeled with antibodies to gephyrin (green), GABAARs (red), and VGAT (blue); region in white box is the dendrite on the right.
(C) 3D reconstructions of the dendrite in (B) and a single synapse. Also see Video S1.
(D) Confocal maximum projection of hippocampal neuron stained under identical conditions to (B).
(E and F) Magnifications of synapses from confocal and SIM images, with line scans perpendicular (E) or parallel (F) to the synapse axis, showing nanoscale subsynaptic domains (SSDs) in the SIM image. White lines show path of line scans.

