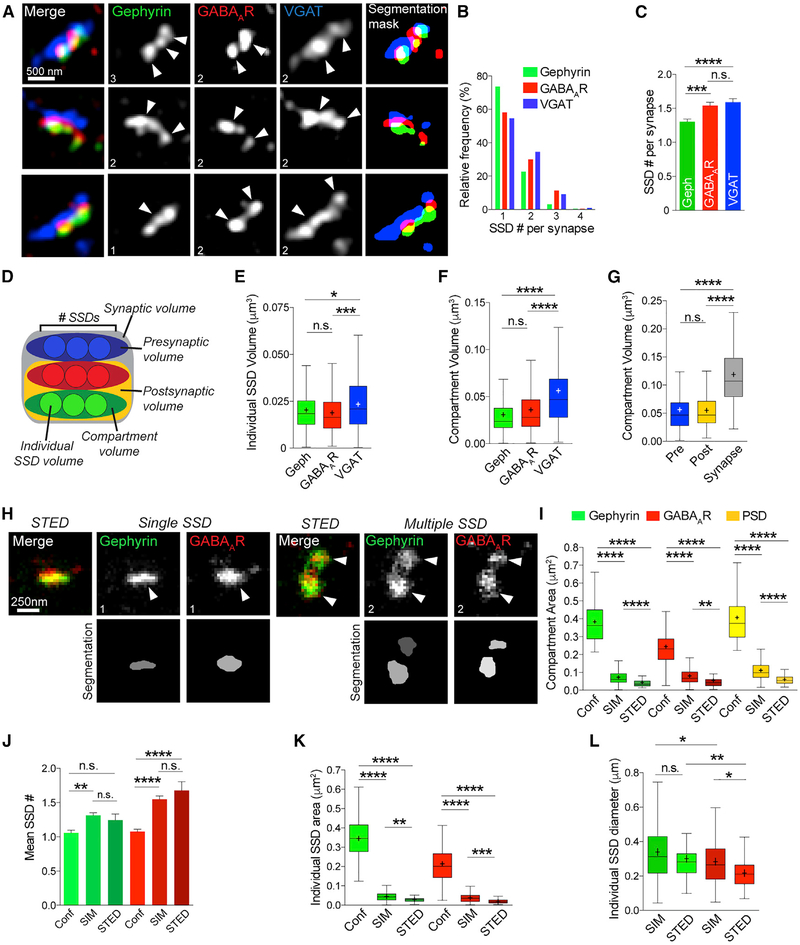
Figure 2. The Inhibitory Postsynaptic Domain Is Composed of Nanoscale SSDs.
(A) Maximum projection SIM images of hippocampal inhibitory synapses and object masks generated by segmentation analysis. Numbers denote number of SSDs in compartment.
(B) Frequency distribution graph of number of SSDs per synapse for gephyrin, GABAAR, and VGAT compartments.
(C) Mean number of SSDs per compartment. ****p < 0.0001 (Kruskal-Wallis); n = 220 synapses. Data are represented as mean ± SEM.
(D) Schematic of volume parameters measured by segmentation.
(E) Box plots of individual SSD volumes for gephyrin, GABAARs, and VGAT. ****p < 0.0001 (Kruskal-Wallis); n = 220 synapses. Cross denotes mean; horizontal line denotes median.
(F) Box plots of compartment volumes for gephyrin, GABAARs, and VGAT. ****p < 0.0001 (Kruskal-Wallis); n = 220 synapses. Cross denotes mean; horizontal line denotes median.
(G) Box plots of compartment volumes for the presynaptic site, postsynaptic site, and whole synapse ****p < 0.0001 (Kruskal-Wallis); n = 220 synapses. Cross denotes mean; horizontal line denotes median.
(H) STED images of gephyrin (green) and GABAARs (red) from hippocampal neuronal dendrites. Numbers denote number of SSDs in compartment.
(I) Box plots of compartment area for gephyrin, GABAARs, and PSD derived from confocal, SIM, and STED images. ****p < 0.0001 (Kruskal-Wallis); n = 54/220/37 synapses. Cross denotes mean; horizontal line denotes median.
(J) Mean number of SSDs per synapse for gephyrin and GABAARs derived from confocal, SIM, and STED images. ****p < 0.0001 (Kruskal-Wallis); n = 54/220/37 synapses. Data are represented as mean ± SEM.
(K) Boxplots of individual SSD area for gephyrin and GABAARs derived from confocal, SIM, and STED images. ****p < 0.0001 (Kruskal-Wallis); n = 54/220/37 synapses. Cross denotes mean; horizontal line denotes median.
(L) Boxplots of SSD diameter for gephyrin and GABAARs derived from SIM and STED images. ****p < 0.0001 (Kruskal-Wallis); n = 54/220/37 synapses. Cross denotes mean; horizontal line denotes median.
See also Figure S1.

