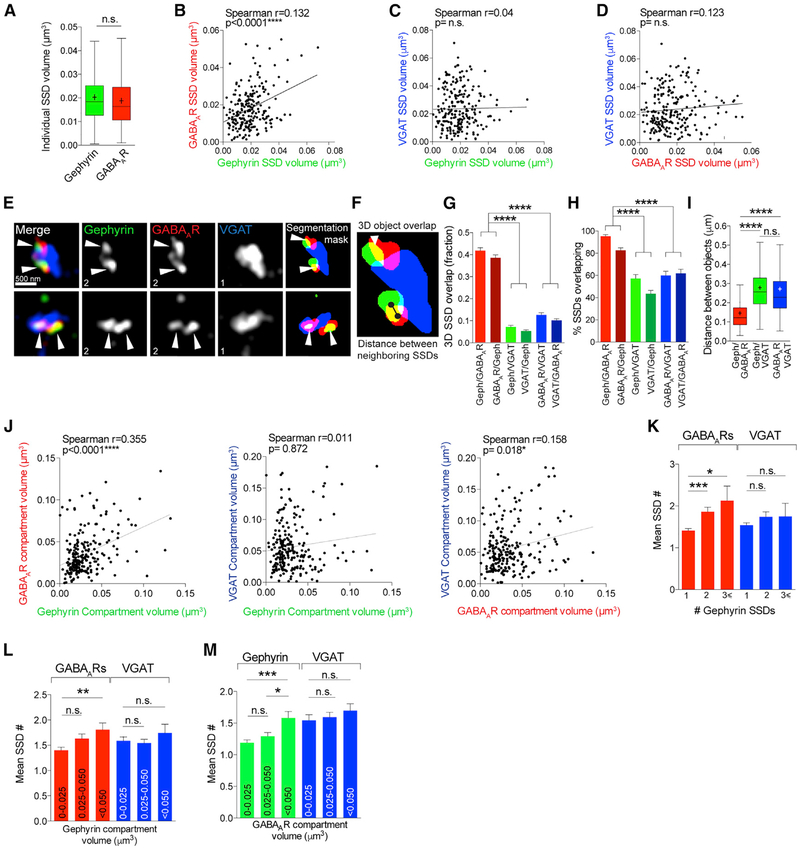
Figure 3. Gephyrin SSDs Cluster Synaptic GABAAR SSDs.
(A) Boxplot comparing gephyrin and GABAAR individual SSD volumes n.s. (Mann-Whitney); n = 220 synapses. Cross denotes mean; horizontal line denotes median.
(B) Correlation plot of mean GABAAR SSD volume and gephyrin SSD volume per synapse. n = 220 synapses.
(C) Correlation plot of mean VGAT SSD volume and gephyrin SSD volume per synapse. n = 220 synapses.
(D) Correlation plot of mean VGAT SSD volume and GABAAR SSD volume per synapse. n = 220 synapses.
(E) Maximum projection SIM images of hippocampal inhibitory synapses and object masks generated by segmentation analysis. Arrowheads point to regions of overlap between gephyrin and GABAAR SSDs. Numbers denote number of SSDs in compartment.
(F) Object segmentation mask showing 3D SSD overlap and center-to-center distance between SSDs.
(G) Mean overlap fraction for gephyrin, GABAARs, and VGAT. ****p < 0.0001 (Kruskal-Wallis, Dunn’s post hoc); n = 220 synapses. Data are represented as mean ± SEM.
(H) Mean percentage of overlapping SSDs. ****p < 0.0001 (Kruskal-Wallis, Dunn’s post hoc); n = 38–40 cells. Data are represented as mean ± SEM.
(I) Boxplot of center-to-center distances between neighboring SSDs. ****p < 0.0001 (Kruskal-Wallis, Dunn’s post hoc); n = 290–340 SSDs. Cross denotes mean; horizontal line denotes median.
(J) Correlation plots of mean compartment volumes for GABAAR, gephyrin, and VGAT. n = 220 synapses.
(K) Mean SSD number per GABAAR or VGAT compartment for gephyrin compartments with 1, 2, or R3 SSDs per compartment. Gephyrin/GABAAR, ****p < 0.0001; gephyrin/VGAT, p = 0.236 (Kruskal-Wallis, Dunn’s post hoc); n = 220 synapses. Data are represented as mean ± SEM.
(L) Mean SSD number per GABAAR or VGAT compartment for a range of gephyrin compartment volumes. Gephyrin/GABAAR, **p < 0.0073; gephyrin/VGAT, p = 0.755 (Kruskal-Wallis, Dunn’s post hoc); n = 220 synapses. Data are represented as mean ± SEM.
(M) Mean SSD number per gephyrin or VGAT compartment for a range of GABAAR compartment volumes. GABAAR/gephyrin ***p < 0.0003; GABAAR /VGAT, p = 0.237 (Kruskal-Wallis, Dunn’s post hoc); n = 220 synapses. Data are represented as mean ± SEM.
See also Figure S2.

