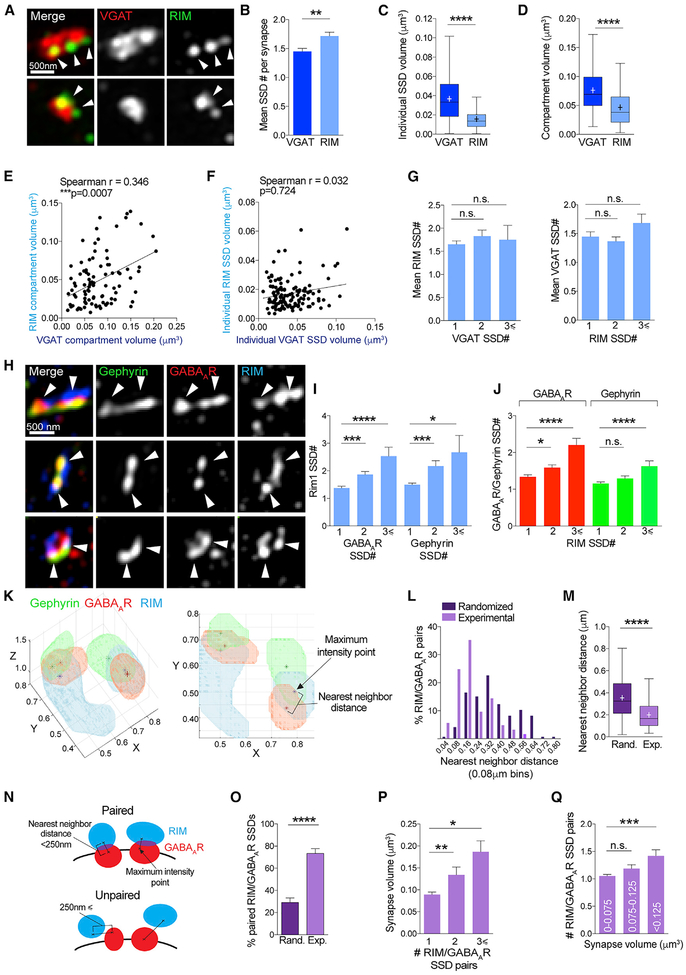
Figure 5. GABAAR SSDs Correlate with Active-Zone RIM SSDs.
(A) Maximum projection SIM images of VGAT and RIM-labeled inhibitory synapses.
(B) Mean number of SSDs per compartment for VGAT and RIM. **p < 0.0026 (Mann-Whitney tests); n = 127 synapses. Data are represented as mean ± SEM.
(C) Boxplot of individual SSD volumes for VGAT and RIM ****p < 0.0001 (Mann-Whitney tests); n = 127 synapses. Cross denotes mean; horizontal line denotes median.
(D) Boxplot of compartment volumes for VGAT and RIM. ****p < 0.0001 (Mann-Whitney tests); n = 127 synapses. Cross denotes mean; horizontal line denotes median.
(E) Correlation plot of VGAT compartment volume and RIM compartment volume per synapse; n = 127 synapses.
(F) Correlation plot of VGAT individual SSD volume and RIM individual SSD volume per synapse; n = 127 synapses.
(G) Mean SSD number per RIM compartment for VGAT compartments with 1, 2, or ≥3 SSDs per compartment and vice versa. n.s. (Kruskal-Wallis, Dunn’s post hoc); n = 127 synapses. Data are represented as mean ± SEM.
(H) Maximum projection SIM images of gephyrin, GABAAR, and RIM-labeled inhibitory synapses.
(I) Mean RIM SSD number per gephyrin or GABAAR compartments with 1, 2, or ≥3 SSDs per compartment. ****p < 0.0001 (Kruskal-Wallis, Dunn’s post hoc); n = 180 synapses. Data are represented as mean ± SEM.
(J) Mean GABAAR or gephyrin SSD number per RIM compartments with 1, 2, or ≥3 SSDs per compartment. RIM/GABAAR, ****p < 0.0001; RIM/gephyrin, p = 0.301 (Kruskal-Wallis, Dunn’s post hoc); n = 180 synapses. Data are represented as mean ± SEM.
(K) 3D and 2D rendering of example inhibitory synapse with 2 SSDs of gephyrin, GABAAR, and RIM (μm). Stars denote maximum intensity point within each SSD.
(L) Frequency distribution of experimental and randomized nearest neighbor distances.
(M) Boxplot of nearest neighbor distance for randomized and experimental datasets. ****p < 0.0001 (Mann-Whitney test); n = 146 RIM/GABAAR SSDs. Cross denotes mean; horizontal line denotes median.
(N) Cartoon showing nearest neighbor distances between maximum intensity points within GABAAR and RIM SSDs in geometrically paired and unpaired SSD synapses.
(O) Bar graph showing percentage of paired RIM and GABAAR SSDs per synapse in randomized and experimental datasets. ****p < 0.0001 (Mann-Whitney test); n = 121 synapses. Data are represented as mean ± SEM.
(P). Mean volume of synapses with 1, 2, or ≥3 RIM/GABAAR SSD pairs per synapse. **p < 0.0019 (Kruskal-Wallis, Dunn’s post hoc); n = 121 synapses. Data are represented as mean ± SEM.
(Q) Mean number of RIM/GABAAR SSD pairs per synapse for a range of synapse volumes. ***p < 0.0004 (Kruskal-Wallis, Dunn’s post hoc); n = 121 synapses. Data are represented as mean ± SEM.
See also Figure S3.

