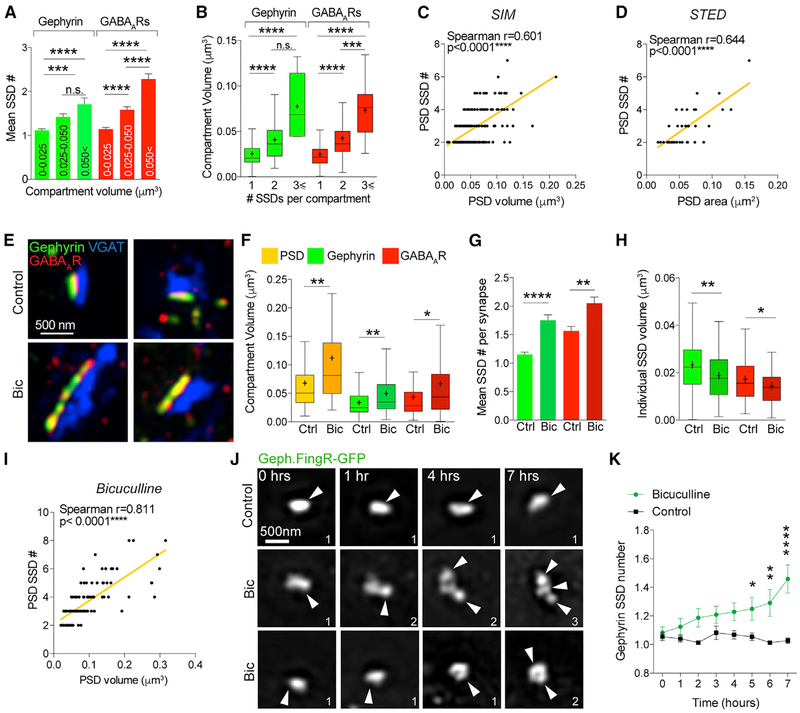
Figure 6. SSDs Are Building Blocks of the Inhibitory Postsynaptic Domain.
(A) Mean number of SSDs per compartment for a range of gephyrin and GABAAR compartment sizes. ****p < 0.0001 (Kruskal-Wallis, Dunn’s post hoc); n = 220 synapses. Data are represented as mean ± SEM.
(B) Mean compartment volume for gephyrin and GABAAR compartments with 1, 2, or ≥3 SSDs per compartment. ****p < 0.0001 (Kruskal-Wallis, Dunn’s post hoc); n = 220 synapses. Cross denotes mean; horizontal line denotes median.
(C) Correlation plot of number of PSD SSDs versus PSD volume from SIM images. n = 220 synapses.
(D) Correlation plot of number of PSD SSDs versus PSD volume from STED images. n = 37 synapses.
(E) Maximum projection SIM images of hippocampal inhibitory synapses from neurons treated with 10 μm bicuculline (Bic; 24 h) or control conditions.
(F) Boxplot of compartment volumes for PSD, gephyrin, and GABAAR compartments in control and Bic conditions. PSD, **p = 0.037; gephyrin, **p = 0.0084; GABAARs, **p = 0.0052 (Mann-Whitney); n = 85/98 synapses. Cross denotes mean; horizontal line denotes median.
(G) Mean SSD number per compartment for control and Bic conditions. Gephyrin, ****p < 0.0001; GABAARs, **p = 0.001 (Mann-Whitney); n = 85/98 synapses. Data are represented as mean ± SEM.
(H) Boxplot of mean individual SSD volume per synapse. Gephyrin, p** < 0.0051; GABAARs, p* = 0.040 (Mann-Whitney); n = 85/98 synapses. Cross denotes mean; horizontal line denotes median.
(I) Correlation plot of number of PSD SSDs versus PSD volume for synapses from bicuculline condition. n = 98 synapses.
(J) Maximum projection SIM images of gephyrin intrabody (Geph.FingR-GFP) acquired live in control or bicuculline treated conditions. Numbers denote number of SSDs in compartment.
(K) Graph summarizing gephyrin SSD number over time in control or Bic conditions. ****p < 0.0001 and **p < 0.01 (two-way ANOVA with Sidak’s post hoc test); n = 73/48 synapses. Data are represented as mean ± SEM.
See also Figure S4.

