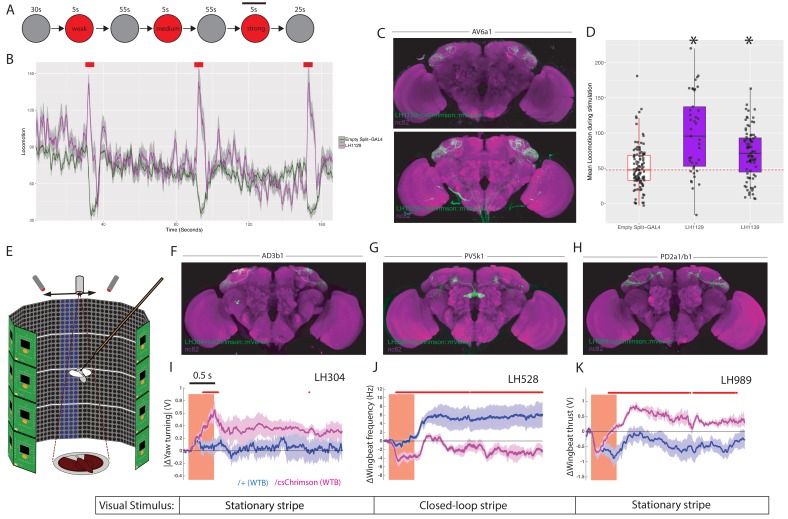
Figure 10. LH neurons drive motor behaviours.(A) Schematic of the Flybowl optogenetic stimulation paradigm.
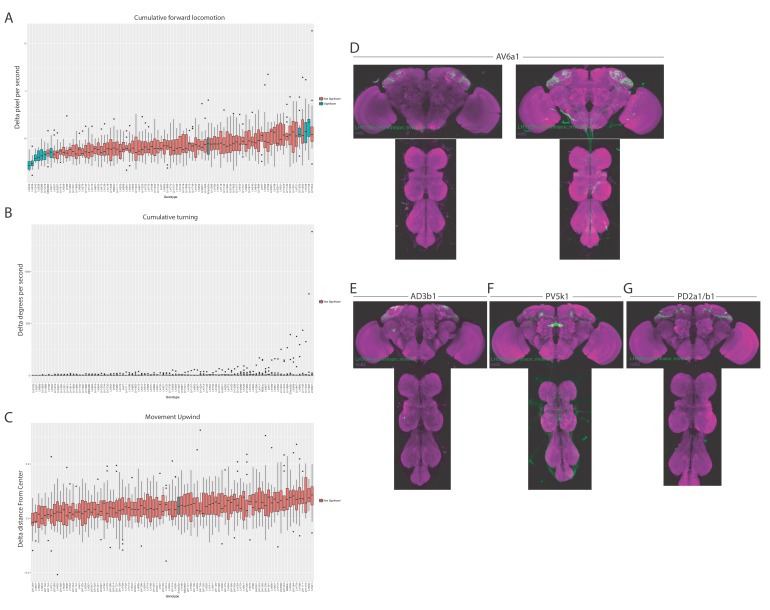
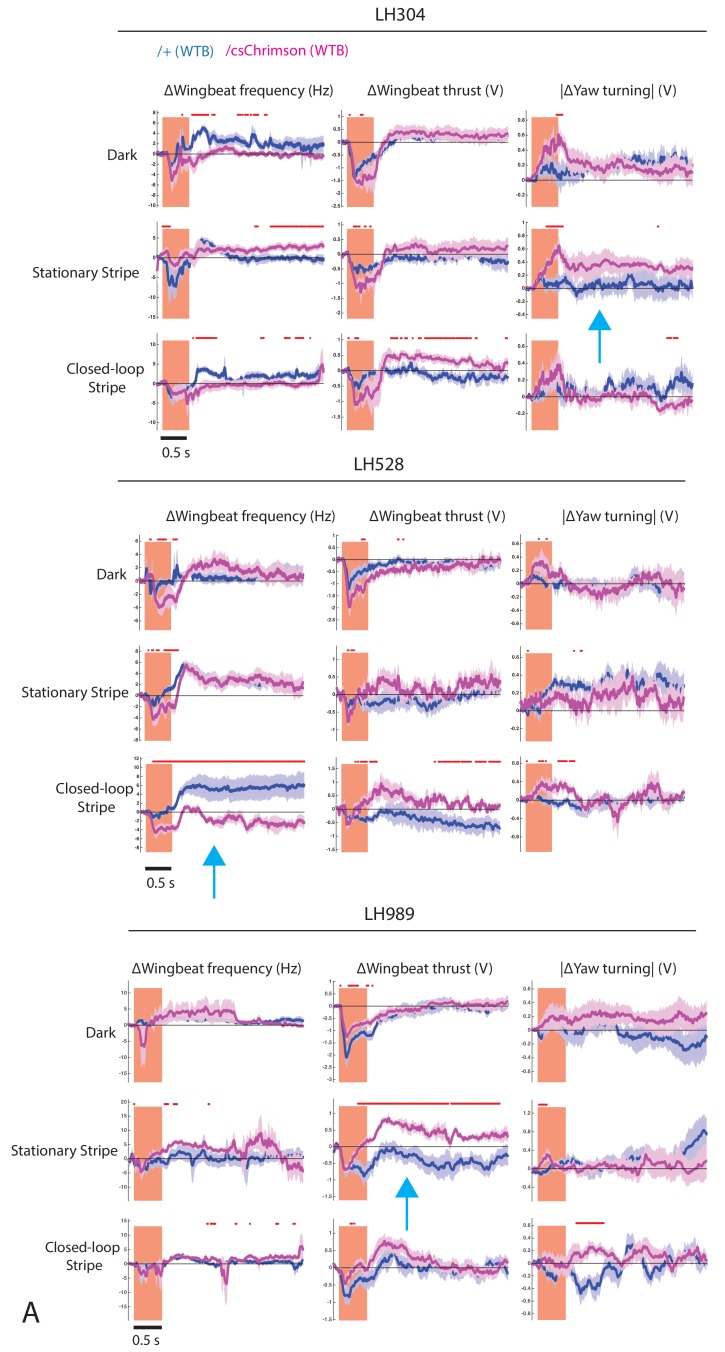
Flies are introduced to the chamber and allowed to acclimatize for 30 s followed by illumination for 5 s, repeated three times. Each stimulation is of a different intensity, from lowest to highest. The flies were continuously tracked and their movements used to calculate the forward locomotion.The black bar above the 3rd stimulation represents the analysis window for D. (B) A graph of the forward locomotion (pixels per second, one pixel is ~0.12 mm) across time, where the split-GAL4 line LH1129 (magenta) is plotted against empty split-GAL4 (green). Line is the mean, grey is the SEM. Activation of LH1129, a split-GAL4 line labelling LH cell type AV6a1, drives an increase in forward locomotion compared to control. Red rectangle indicates light ON period of increasing intensity. (C) Z-projection of the brain expression patterns of the two split-GAL4 lines for cell type 7A, LH1139 (top) and LH1129 (bottom). Note minor trachea labelling in LH1129. All split-GAL4 lines are driving csChrimson::mVenus (green), the neuropil stain is nc82 (magenta). See Figure 10—figure supplement 1 for full brain and nerve cord expression patterns. (D) Boxplots analysing the mean locomotion during the strongest stimulation window of five seconds (locomotion measured in pixels per second, one pixel is ~0.12 mm). Each dot represents the behaviour of a single fly. Asterisk indicates significantly different from the empty split-GAL4 control. (E) Schematic of the flying optogenetic stimulation paradigm. Animals are tethered in a flight area. Flying animals have either no visual stimulus, a stationary bar or a closed loop blue bar. During flight optogenetic stimulation is driven by LED stimulation bilaterally. Schematic was modified with permission. (F–H) Z-projection of the brain expression patterns of the three split-GAL4 lines used in the flight assay: (F) LH304, (G) LH528 and (H) LH989. All split-GAL4 lines are driving csChrimson::mVenus (green). Note for all expression pattern images, the neuropil stain is nc82 (magenta). See Figure 10—figure supplement 1 for full brain and nerve cord expression patterns. (I) The absolute value of yaw (turning) over time (seconds) of single LH304 split-GAL4 flies crossed to experimental (magenta) and control genotypes (dark purple). This represents turning. (J) The wingbeat frequency over time (seconds) of single LH528 split-GAL4 flies crossed to experimental (magenta) and control genotypes (dark purple). The reduction in wingbeat frequency represents a reduction in speed and persists after stimulation. (K) The wingbeat thrust over time (seconds) of single LH989 split-GAL4 flies crossed to experimental (magenta) and control genotypes (dark purple). The increase in thrust represents increased power. WTB = Wild Type Berlin background strain. In I-K, lines are mean traces from all animals, coloured shades around the lines are standard errors of the mean across the animals (n = 6 for each genotype). The rectangle pink shades indicate the periods of activation light on. The red +marks above each plot indicate the time points at which the CsChrimson traces are significantly different from the negative control traces (Wilcoxon rank sum test, p<0.05). Time scale for 0.5 s is on the top of the first stimulation period.


