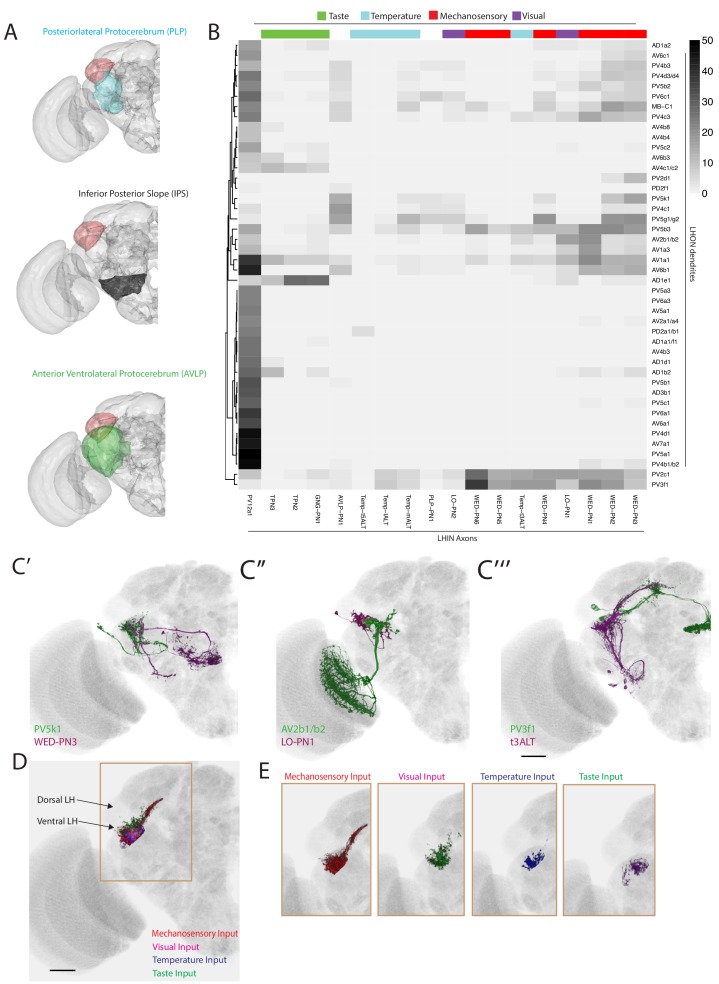
Figure 7. The LH receives non-olfactory input to a restricted ventral zone.
(A) Volume renderings of fly brain (grey) with PLP (blue), IPS (black) and AVLP (green) labelled. The LH in each panel is labelled in red. (B) Heatmap of percentage overlap score between masks of LHON dendrites against the axons of non-canonical LHINs. The tracks of columns represent the presumed modality of the LHIN, as determined by position of their dendrites. Temp-ALT etc represents four different types of temperature PNs (Frank et al., 2015). (C’) Volume rendering showing overlap of PV5k1 (green) and WED-PN3 (magenta), both of which are expression patterns from different brains registered to the JFRC2013 template brain. (C’’) Volume rendering showing overlap of AV2b1/b2 (green) and LO-PN1 (magenta), both of which are expression patterns from different brains registered to the JFRC2013 template brain. (C’’’) Volume rendering showing overlap of PV3f1 (green) and the temperature projection neuron t3ALT (magenta), both of which are expression patterns from different brains registered to the JFRC2013 template brain. (D) Mutimodal input to the LH is restricted to a ventral zone. Averaged axonal representations across different cell types for each non-olfactory sensory modality (mechanosensory, temperature, visual and taste) overlaid onto the JFRC2013 template brain demonstrating these inputs are restricted to the ventral LH. Scale bar is 30 μm. (E) Individual volume renderings of the averaged axonal representations (only pixels in the LH are displayed) for each sensory modality, visual (top left), temperature (top right), mechanosensory (bottom left) and taste (bottom right).


