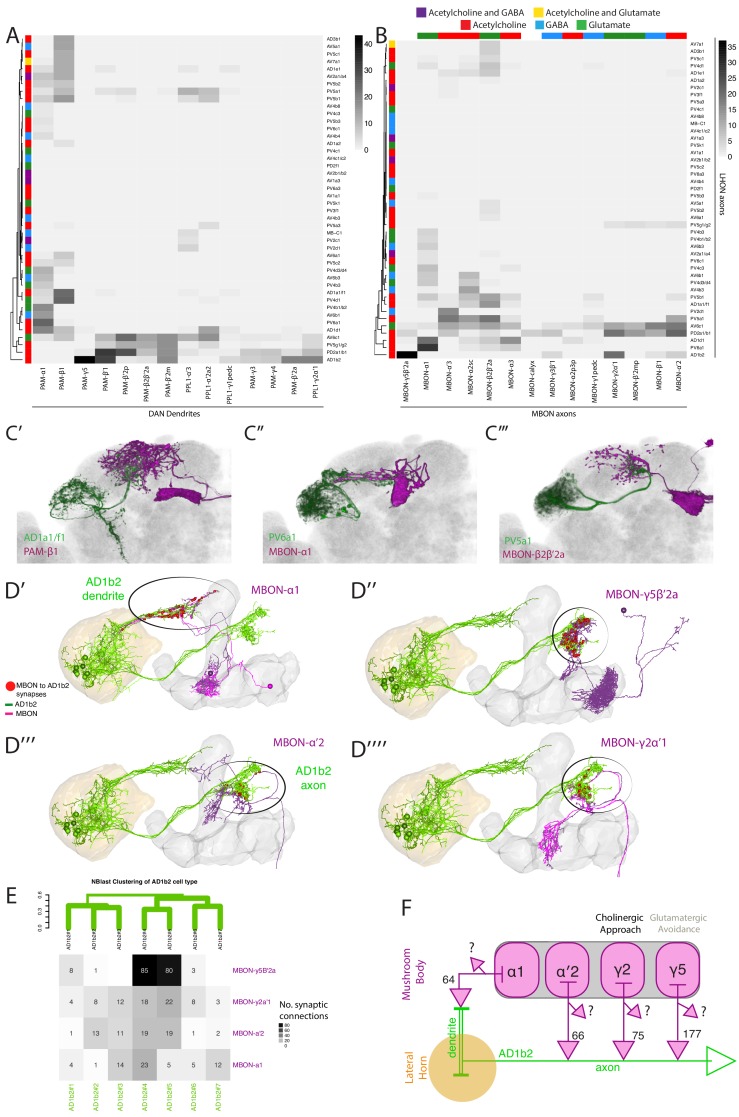
Figure 8. Identifying interactions between the innate and learned olfactory processing centers.
(A) Heatmap of percentage overlap score between masks of LHON axons and DAN dendrites. The tracks of the rows represent the neurotransmitter, as determined by immunohistochemistry for acetylcholine, GABA and glutamate. (B) Heatmap of percentage overlap score between masks of LHON axons and MBON axons. The tracks of the rows and columns represent the neurotransmitter for LHONs and MBONs respectively. White asterisks represent cell type pairs that are illustrated with volume renderings (see below). (C’) Volume rendering showing overlap of AD1a1/f1 (green) and PAM-β1 (magenta) (C’’) Overlap between PV6a1 and MBON-α1 (C’’’) PV5a1 and MBON-β2β′2a. All of C’-C’’’ are expression patterns from different brains registered to the JFRC2013 template brain. (D) EM reconstructions of AD1b2 (green) and MBONs (magenta), illustrating synaptic connectivity from MBON-α1, MBON-γ5β′2a, MBON-α′two and MBON-γ2α′one onto AD1b2. (D’) MBON-α1 forms synapses on AD1b2 dendrites which are outside of the LH. (D’’–D’’’’) MBON-γ5β′2a, MBON-α′two and MBON-γ2α form axoaxonic synapses onto AD1b2 in the SMP. The LH and MB volumes are labelled in orange and light grey respectively. Red spheres represent synapses from MBON onto AD1b2. Black circle highlights region of synapses. (D’’) Reconstruction of seven AD1b2 neurons (green) and MBON-γ2α1 (black) in the EM volume. The LH and MB volumes are labelled in red and light grey respectively. Red spheres represent synapses from MBON-γ2α1 onto the AD1b2 axonal compartment. (E) Heatmap of synaptic connectivity from MBONs onto each AD1b2 neuron revealing the variability of connectivity across individual AD1b2 neurons. Green dendrogram is a morphological clustering of individual AD1b2 neurons by NBLAST. (F) Cartoon summary of dendritic and axoaxonal connectivity from MBONs onto AD1b2 axons. Note that all MBONs also have other currently unknown downstream synaptic partners .


