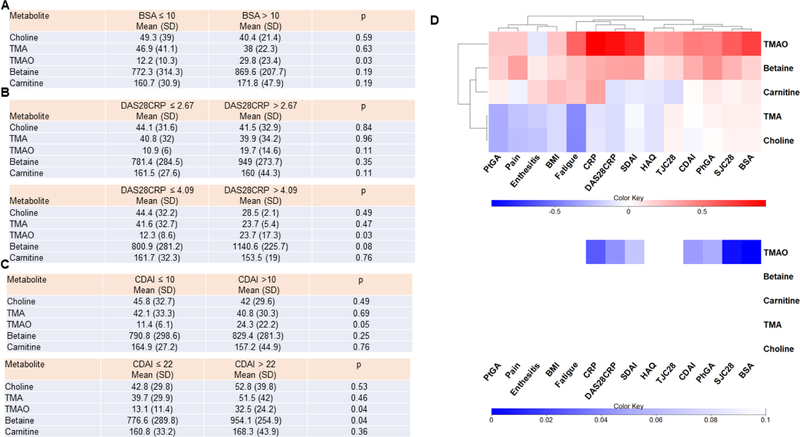
Figure 2. Relation of choline metabolites with skin and joint disease activity.
A) Logistic regression was performed for each metabolite in patients with BSA ≤10 compared with patient with BSA > 10, adjusting for age and gender. B and C) Logistic regression was performed for each metabolite in patients with low disease activity (measured by either DAS28CRP ≤ 2.67 or CDAI ≤10) and patients with moderate and high disease activity (DAS28CRP > 2.67 or CDAI > 10), adjusting for age and gender. Logistic regression was also performed for each metabolite in patients with mild or moderate disease activity (measured by either DAS28CRP ≤ 4.09 or CDAI ≤ 22) and patients with high disease activity (DAS28CRP > 4.09 or CDAI > 22) adjusting for age and gender. D) Linear regression was performed between each clinical score – metabolite pair, controlling for age and gender. In the left panel, the regression coefficients for each pair were used to form a clustered heatmap, to lend insight into which clinical scores were correlated with which metabolite. Row clusters have been identified by cophenetic cutting of the row dendrogram. In the right panel, metabolite regression p-values are displayed, where the row and column order are preserved from left panel. TJC: tender joint count; SJC: swollen joint count; CDAI: clinical Disease Activity Index; SDAI: Simple Disease Activity Index; HAQ: Health Assessment Questionnaire; PhGA: physician global assessment; PtGA: patient global assessment; BMI: body mass index; BSA: body surface area; DAS28CRP: disease assessment score 28. Concentrations are provided as ng/ml.

