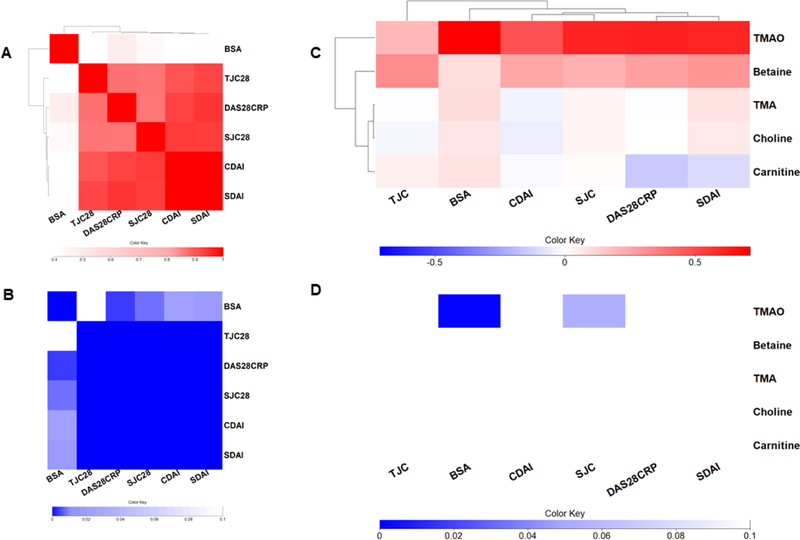
Figure 3. Choline metabolite regression after BSA and CDAI.
A) The Pearson correlation coefficients for each pair of clinical scores were used to form a clustered heatmap, to evaluate the relationship between joint and skin disease scores. B) The p values are displayed in Figure 3B where the row and columns are preserved from Figure 3A. C) Linear regression was performed between each clinical score – metabolite pair, controlling for age and gender. TJC, SJC, DAS28CRP, CDAI and SDAI were also adjusted by BSA, and BSA was also adjusted by CDAI. The regression coefficients for each pair were used to form a clustered heatmap. D) Metabolite regression p-values are displayed in Figure 3D, where the row and column order are preserved from Figure 3C. TJC: tender joint count; SJC: swollen joint count; CDAI: clinical Disease Activity Index; SDAI: Simple Disease Activity Index; BSA: body surface area; DAS28CRP: disease assessment score 28.

