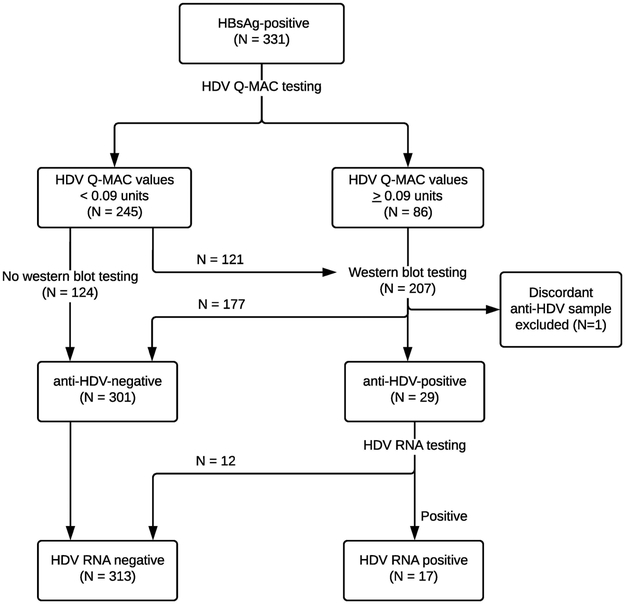
Figure 1: Flow chart to depict the HDV testing algorithm.
The flow chart shows the algorithm used to test samples for HDV in the study. All samples that were HBsAg-positive (N=331) were tested for HDV using the Q-MAC assay. Of the 245 samples that had Q-MAC values <0.09, 124 samples were not tested with western blot and were considered anti-HDV-negative, while 121 samples were tested with western blot and were all anti-HDV-negative. During replicate testing, one sample had discordant western blot result and was removed from the study, yielding 330 HBsAg-positive participants (250 cases and 80 controls) who were included in the overall analysis. Among the remaining samples that had Q-MAC values ≥0.09 units and were tested with western blot assay, 29 samples tested anti-HDV-positive, and were further tested for HDV RNA using an RT-PCR assay.
Abbreviations: HBsAg, hepatitis B surface antigen; HDV, hepatitis D virus; Q-MAC, quantitative microarray antibody capture; RNA, ribonucleic acid

