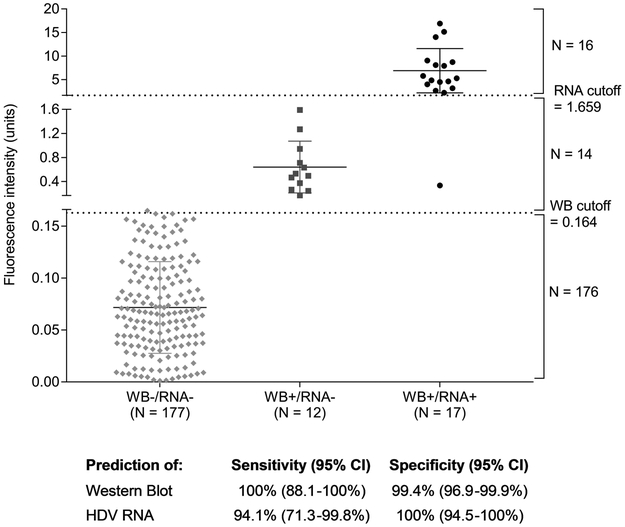
Figure 2: Performance of the HDV Q-MAC assay compared to the western blot and HDV RNA assays.
The figure plots the fluorescence intensity derived from Q-MAC assay against the findings for the same samples from western blot and HDV RNA assays. The one sample with discordant result was removed from all analyses. Of the remaining 206 samples tested, 17 were positive for both western blot and HDV RNA, 12 were positive for western blot but negative for HDV RNA, and 177 were both western blot and HDV RNA-negative. There was 100% concordance between the western blot and Q-MAC results using the proposed Q-MAC assay cutoff of 0.164 units for anti-HDV positivity 11. Of the 17 HDV RNA-positive samples, 16 exceeded 1.659 fluorescence intensity units in the Q-MAC assay, the proposed cutoff for predicting HDV RNA positivity. The sensitivity and specificity for the comparisons are provided at the bottom of the figure.
Abbreviations: HDV, hepatitis D virus; NPV, negative predictive value; PPV, positive predictive value; Q-MAC, quantitative microarray antibody capture; RNA, ribonucleic acid

