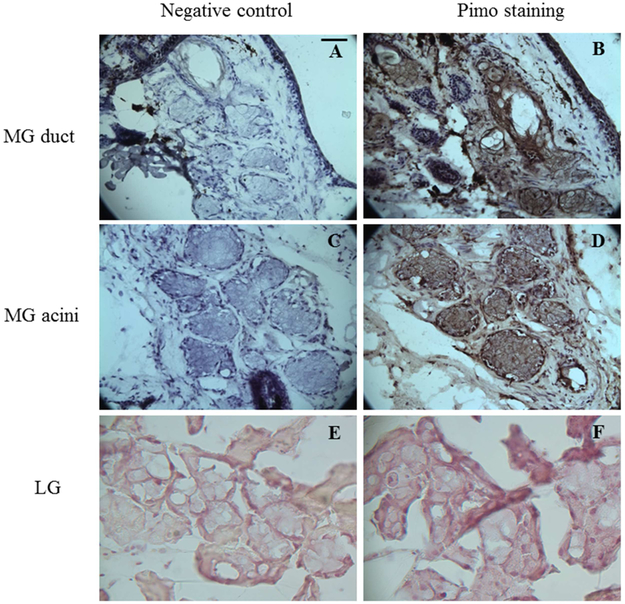
Figure 3.
Pimo staining of mouse MGs and LGs. Both the MG duct (arrows) and acini (notched arrows) show high intensity of Pimo, as do the mouse SGs (* in B). LG shows no staining of pimo. Data from one experiment are shown as a representative of three studies performed under the same conditions. Scale bar = 5 μM.

