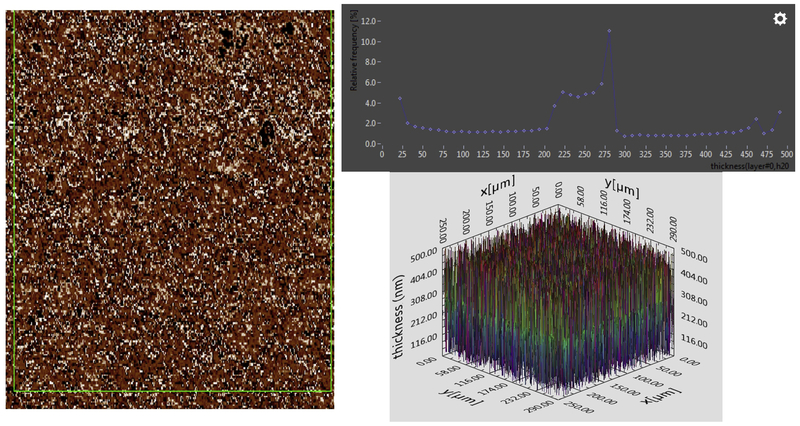
Figure 3.
Tears analysed immediately after collection from the same subject as shown in Figure 2, but collected one week later. Left, image map shows relative intensity from 21 nm (black) to 500 nm (white). Top right, histogram is taken from the area depicted in green. Bottom right, 3D map of thickness fit from Ψ and Δ at each pixel. Notice the baseline is slightly irregular.

