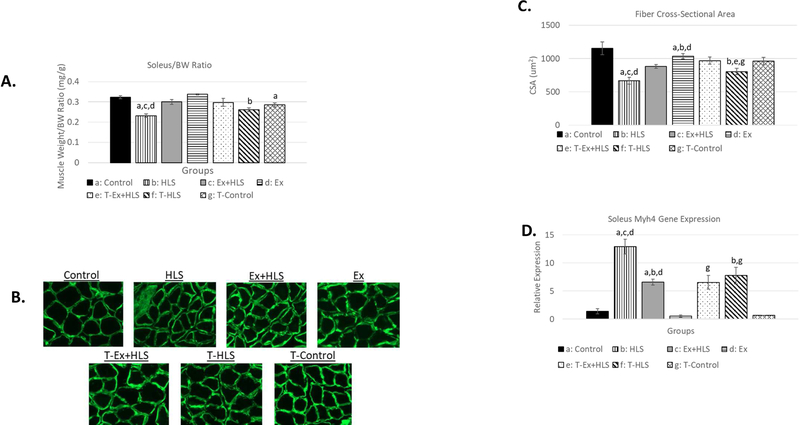
Figure 1.
A. Soleus muscle weight to bodyweight ratio (mg/g) of wild-type and TFAM transgenic groups (n=6). B. Immunofluorescence images of anti-laminin staining to visualize muscle fiber size and shape. All pictures are cropped to 200µm in width. C. Mean cross-sectional area measurement comparison between groups of anti-laminin staining images calculated using ImageJ software (n=6). D. Myosin Heavy chain 4 (Myh4) gene expression analysis of the soleus muscle (n=6). Statistical significance (p<.05) indicated by the corresponding group letter (means ± SE).

