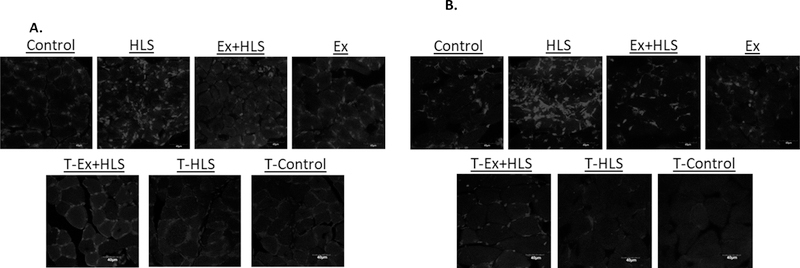
Figure 5.
A. Observational soleus dihydroethidium staining for ROS. Figures are black and white. Bright spots are assumed to be positive staining for ROS (n=6, scale=40µm). B. Observational gastrocnemius dihydroethidium staining for ROS. Figures are black and white. Bright spots are assumed to be positive staining for superoxide anion (n=6, scale=40µm).

