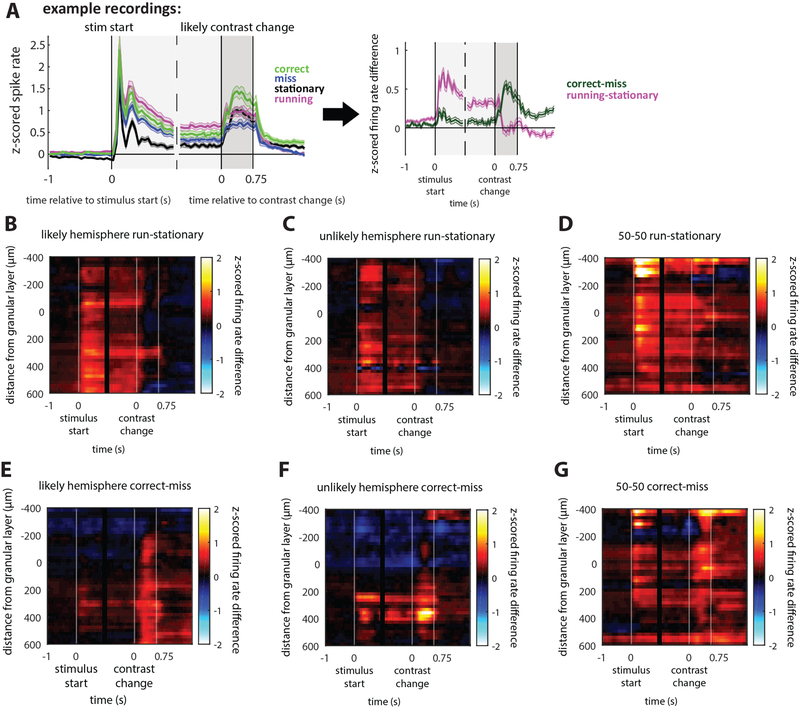
Figure 3: Changes in firing rate across conditions.
(A) Example z-scored firing rates averaged from deep-layer (infragranular, below layer 4) neurons in the likely hemisphere of 80–20 mice. Different trial conditions are shown and aligned to stimulus start and contrast change: correct (green line), miss (blue line), running (magenta line), and stationary (black line) trials. To compare conditions, we subtracted correct minus miss (correct-miss) and running minus stationary (running-stationary) z-scored firing rates. Example corresponds to average of deep layer units (panels B and E). Significant differences shown in Figure S5.
(B-D) Effect of locomotion on stimulus-aligned z-scored firing rates versus recording depth. Color indicates magnitude of firing rate difference. Locomotion increases stimulus-evoked firing rates relative to stationary trials across layers in both 80–20 and 50–50 mice, which is sustained until the contrast change, but the increase is not sustained after the contrast change.
(E-F) Selection affects firing rates differently to locomotion. On correct versus miss trials in 80–20 mice, stimulus-evoked firing rates increase slightly in deep layers and decrease in superficial layers. The response to the contrast change is selectively enhanced on correct trials versus miss trials.
(G) In 50–50 mice on correct trials, both stimulus-evoked and change-evoked activity are increased across layers in 50–50.
80–20 likely hemisphere N=643 neurons; unlikely N=403 neurons; 50–50 N=658 neurons. See also Figures S3, S7.

