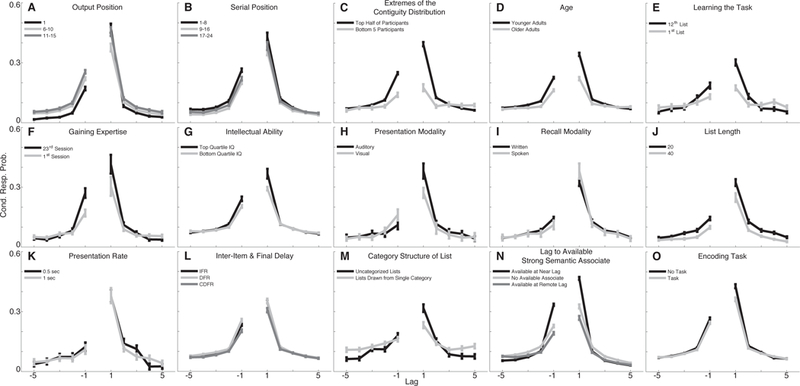
Figure 2.

Many variables influence the contiguity effect. (A) Output position 1 vs. output positions 6–10 and 11–15 from PEERS Experiment 4. (B) Transitions originating from serial positions 1–8, 9–16, and 17–24 from PEERS Experiment 4. (C) Subjects with temporal factor scores in the top half of the distribution vs. subjects with the 5 lowest scores across both age groups in PEERS Experiment 1. (D) Younger vs. older adults in PEERS Experiment 1. (E) First vs. last (12th) list in the screening session of PEERS. (F) Naïve subjects’ first vs. 23th session in PEERS Experiment 4. (G) Top vs. bottom quartile of the younger adult IQ distribution in PEERS Experiment 1. (H) Auditory vs. visual presentation in the 1 sec presentation rate condition in Experiment 1 of Murdock and Walker (1969). (I) Written vs. spoken recall in Murdock and Walker (1969) and Murdock (1962) respectively (20-item lists presented auditorily for 1 sec/item in both cases). (J) List length 20 vs. 40 in Murdock (1962, 1 sec presentation rate). (K) Presentation rates of 0.5 sec vs. 1 sec in Experiment 1 of Murdock and Walker (1969). (L) Immediate, delayed, and continual distractor recall conditions from PEERS Experiments 1–3. (M) Uncategorized lists vs. lists drawn from a single category in McCluey et al. (2018). (N) Transitions originating from items that had a strong associate (WAS cos(θ) > .7) available only at lags > 5 vs. items that had a strong associate available at lags ≤ 2 vs. items that had no strong associates available in PEERS Experiments 1–3. (O) Lists with vs. without an encoding task in Immediate free recall lists of PEERS Experiments 1–3.
