
Figure 5.
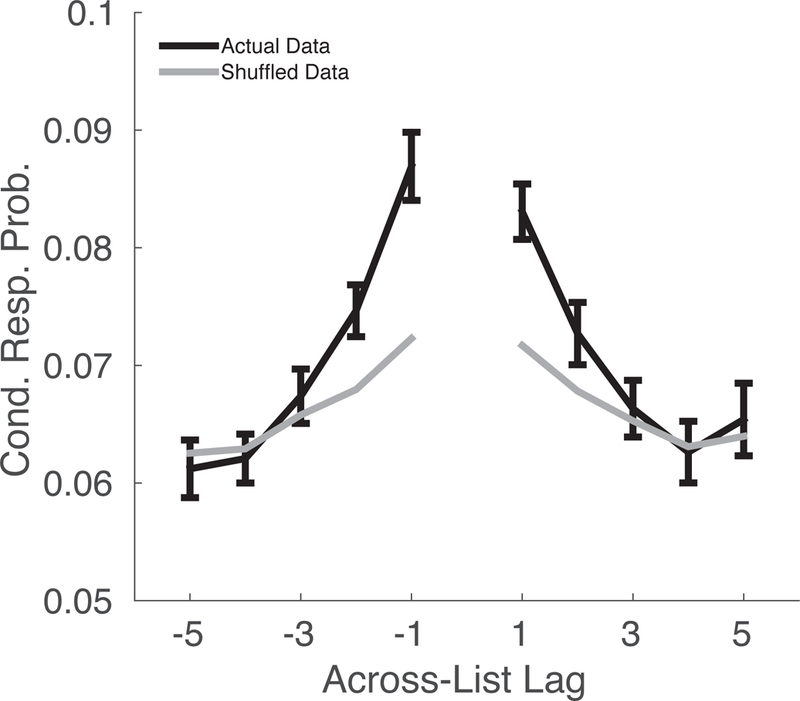
Across-list transitions during final free recall show a contiguity effect. The black curve shows the conditional response probabilities computed from the actual data. The gray curve shows the conditional probability from surrogate data in which the order of recalls are randomly shuffled. The across-list contiguity effect is larger in the actual data than in the surrogate data. Data are from PEERS Experiments 1–3. Error bars are 95% within-subject confidence intervals (Loftus & Masson, 1994).