Figure 2.
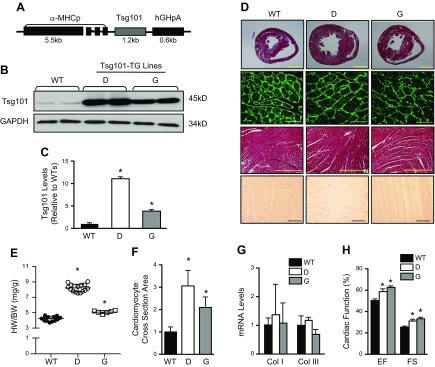
Generation and characterization of Tsg101-TG mice. A) Schematic diagram showing the Tsg101-TG construct. B, C) Western blots and quantification showing overexpression of Tsg101 in TG mouse hearts. GAPDH was used as loading control (n = 6). D) Histologic sections of hearts showed cardiac hypertrophy in TG lines compared with WT mice; n = 3 hearts for each group. Three constitutive sections of each heart were examined (scale bars, 5 mm). Immunostaining of heart sections from WT and TG lines with fluorescent-labeled WGA (Oregon Green 488–conjugated WGA, 1:500; scale bars, 20 μm). Representative images of Masson’s Trichrome (scale bars, 200 μm) and Picrosirius Red staining (scale bars, 100 μm) showed no signs of histopathology. Three constitutive sections of each heart were stained. E) Increased ratios of HW:BW in Tsg101-TG mice compared with WT mice; n = 15 for WT, n = 17 for D, n = 7 for G. F) Quantification results for WGA staining of heart sections shown in D; n = 6. G) mRNA levels of cardiac fibrosis markers measured by RT-PCR; n = 5. H) Overexpression of Tsg101 improves cardiac function determined by echocardiography. Col I, collagen I; Col III, collagen III; D, transgenic line D; G, transgenic line G; n = 8 for WT, n = 6 for D, n = 7 for G. *P < 0.05 vs. WTs.

