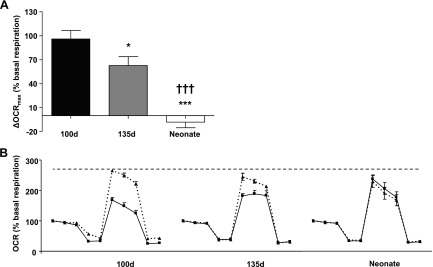
Figure 5.
Difference in OCRmax between control sheep cardiomyocytes and cardiomyocytes with suppressed MEIS1 expression. A) Seahorse oxygen consumption data in control cells and cells transfected with siRNA against MEIS1 from 100-d fetal (black), 135-d fetal (gray), and 24-h neonatal (white) sheep cardiomyocytes. By setting the basal respiration level to 100% and subtracting the maximal respiration level, the spare respiratory capacity was obtained [OCRmax (%basal respiration)]. The ΔOCRmax (%basal respiration) between control and siRNA-transfected cells is shown. B) The individual mitochondrial stress test curves for control (solid line) vs. siRNA-transfected cells (dashed line) for each age studied. Data presented as means ± se; n = 5. *P < 0.05 vs. 100 d, ***P < 0.001 vs. 100 d, †††P < 0.001 vs. 135 d.

