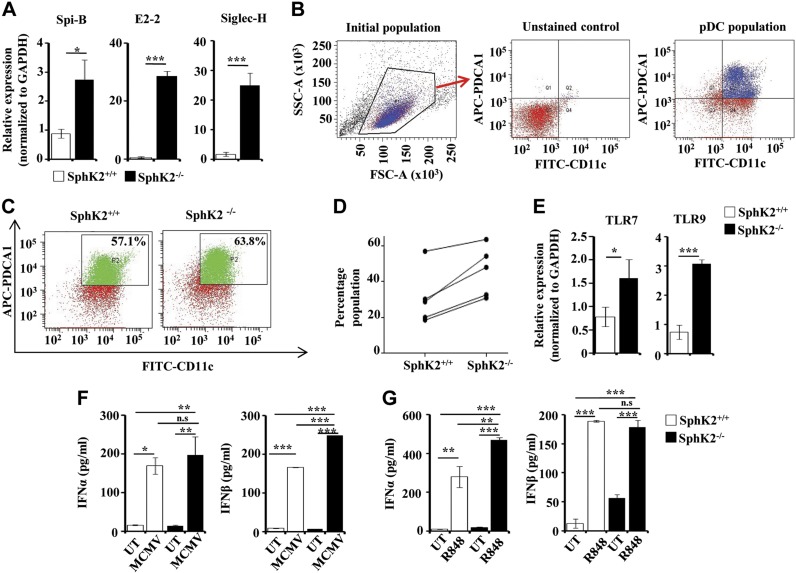
Figure 1.
Effect of SphK2 on pDC development and function. A) pDC-specific markers SpiB, E2-2, and Siglec H were examined in the peripheral blood of SphK2+/+ and SphK2−/− mice by quantitative PCR. The fold change was calculated after normalizing with GAPDH. Data are expressed as means ± sd of 3 independent experiments (n = 7 mice/group). B–D) FACS analysis of pDCs. Flt3L-DCs from SphK2+/+ and SphK2−/− mice were analyzed by FACS by staining for both CD11c and PDCA-1. B) The gating strategy of FACS is shown. The cells were first gated using FSC and SSC plots. Unstained samples were used to determine the gating for both FITC and APC. See Materials and Methods section for more details. C) The dot plots are representative of 5 different experiments showing Flt3L-pDCs generated from SphK2+/+ and SphK2−/− mice. D) Percent populations of Flt3L-pDCs positive for both CD11c and PDCA-1, sorted out by FACS (D). Data from 5 independent experiments are shown. E) Expression of TLR7 and TLR9 in Flt3L-DCs generated from SphK2+/+ and SphK2−/− mice was determined by quantitative PCR and expressed as fold change after normalizing with GAPDH. Similar results were obtained in 3 independent experiments (n = 5 mice/group). F) Flt3L-DCs (1 × 10⁵ cells) isolated by cell sorting from SphK2+/+ to SphK2−/− mice were treated without or with MCMV (multiplicity of infection = 1). After 18 h, cell supernatants were collected and analyzed by ELISA for IFN-α and β. Similar results were obtained in 3 independent experiments (n = 5 mice/group). G) SphK2+/+ and SphK2−/− mice were tail-vein injected with 2 µg of R848 per mouse, and blood was collected after 2 h. Serum was separated and analyzed by ELISA for type I IFN secretion. Statistical significance was assessed by a Student's unpaired t test (A, E) or by ANOVA (F, G) followed by a Tukey’s post hoc test; n.s., not significant. *P < 0.05, **P < 0.005, ***P < 0.001.

