Figure 5.
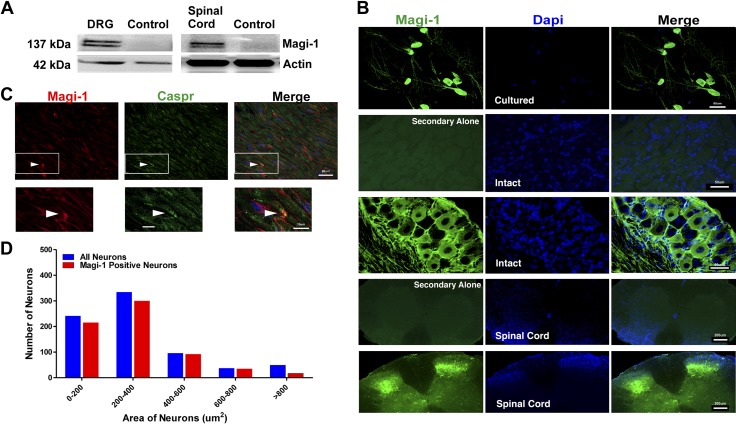
Magi-1 is expressed in DRG neurons, the SC, the SN, and at nodes of Ranvier. A) Representative immunoblots depicting Magi-1 expression from intact DRG (left) and SC (right). Untransfected CHO cell lysates were used as the control lane. CHO cells do not endogenously express Magi-1 Supplemental Fig. S1). B) Immunolabeling images showing Magi-1 (green) expression in cultured DRG neurons (panel 1), DRG sections (panel 2 and 3), and the SC (panels 4 and 5) using a previously validated monoclonal antibody. Panels 2 and 4 depict control immunolabeling, stained with secondary antibody only. DAPI (blue) labels all nuclei of cells. Scale bars, 50 μm for DRGs and 200 μm for SCs. C) Double immunolabeling depicting Magi-1 (red) and the paranodal marker Caspr (green) in SN sections (top). Arrows indicate Magi-1 labeling at nodes of Ranvier. Insets represents high-magnification images of Magi-1 immunoreactivity at nodes (bottom). Scale bars, 20 μm (top) and 10 μm (bottom). D) Frequency distribution of Magi-1 in intact DRG neurons of varying cell body size. A total of 735 neurons from 4 mice were analyzed. Neurons larger than 800 μm2 did not show high levels of Magi-1 expression.

