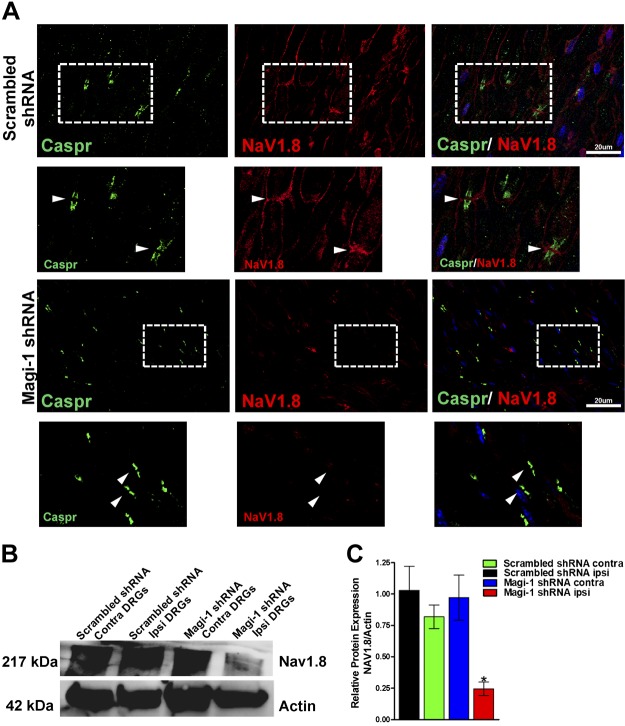
Figure 8.
NaV1.8 expression decreases after Magi-1 knockdown in vivo. A) Representative immunolabeling of SN depicting NaV1.8 (red) expression in paw injected with nontargeting shRNA after 15 d (top); expression of NaV1.8 at nodes of Ranvier was detected using the paranodal marker Caspr (green). Boxed areas shown are a high-magnification image of NaV1.8 and Caspr immunoreactivity (original magnification value, ×63). NaV1.8 immunoreactivity was absent in SN and at nodes in paw injected with Magi-1–targeting shRNA after 15 d (bottom). Scale bars, 20 µm. B) Representative immunoblots of NaV1.8 expression from ipsilateral and contralateral DRG lysates of mice injected in the SN with nontargeting Magi-1 shRNA (scrambled) or Magi-1–targeting shRNA. Representative blot shown for each condition is taken from the same mice. C) Quantification of NaV1.8 expression is shown on the right. Lumbar DRGs from 3 different animals were analyzed, and values are expressed as ± sem. *P < 0.05 vs. representative controls. Contra, contralateral; ipsi, ipsilateral.

