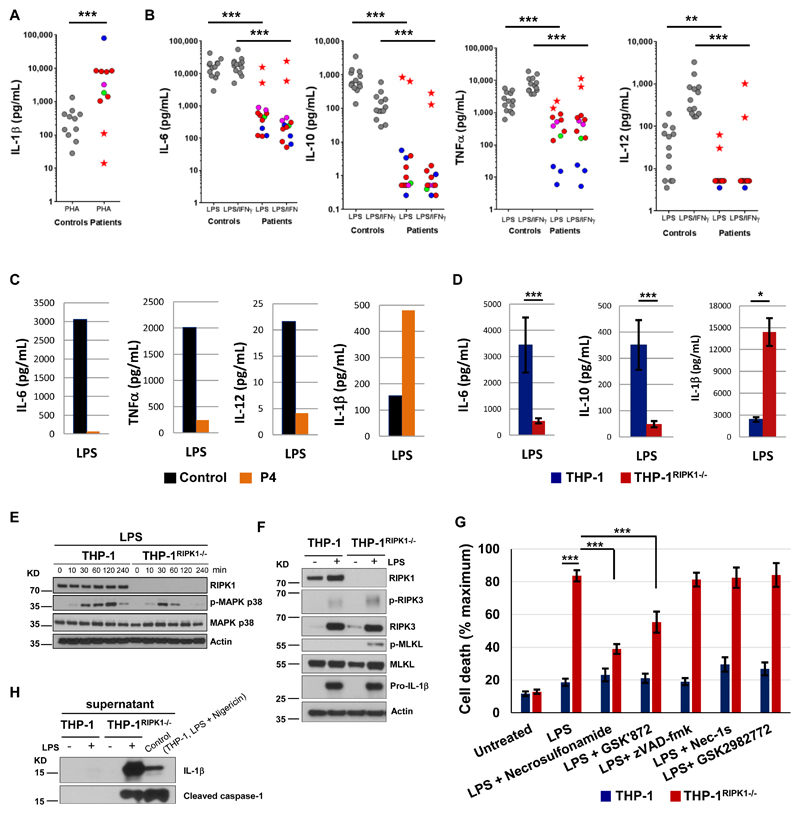
Fig. 3. RIPK1-deficient immune cells show dysregulated cytokine production, impaired MAPK signaling and necroptosis.
(A-B) Cytokines were measured in whole blood after 24 hours stimulation using 10 μg/mL PHA (A) or 1 μg/mL LPS or 1 μg/mL LPS plus 20,000 IU/mL IFN-γ (B). To account for lymphopenia data were corrected for lymphocyte counts. Controls are shown as grey circles, patients as colored circles (P1 – magenta, P3 – blue, P4 – green, P2 before HSCT – red); P2 after HSCT – red star. P-values were calculated using two-tailed Mann-Whitney test, excluding the data of P2 after HSCT. (C) CD14+ monocytes were purified from PBMC of patient P4 (age 3 y) and a healthy adult (travel control), stimulated overnight with 5 μg/mL LPS and then cytokines were measured in supernatants. N = 1, two technical replicates, graphs show mean values. (D) THP-1 cells (2 wild-type and 7 THP-1RIPK1-/- clones) were treated with 50 ng/mL phorbol 12-myristate 13-acetate (PMA) for 3 days, rested for 1 day and stimulated overnight with 5 μg/mL LPS. Cytokines were measured in supernatants. The data were corrected for the estimated number of live cells and show means combining data for different clones ± SEM. P-values were calculated using two-tailed unpaired T-test. (E) THP-1 cells were treated with PMA as in (D), stimulated with 1 μg/mL LPS and the extracted proteins were analyzed by immunoblotting (N = 2). (F) THP-1 cells were stimulated with 5 μg/mL LPS for 48 hours and the extracted proteins were analyzed by immunoblotting (N = 2). (G) THP-1 cells were stimulated with 5 μg/mL LPS for 48 hours in the presence of indicated compounds and cell death was measured using lactate dehydrogenase (LDH) release assay (N ≥ 4). The data show means ± SEM. P-values were calculated using two-tailed unpaired T-test. (H) Supernatants of THP-1 cells studied in (F) were analyzed by immunoblotting (N = 1). * P < 0.05, ** P < 0.01, *** P < 0.001.

