
Fig. 2.
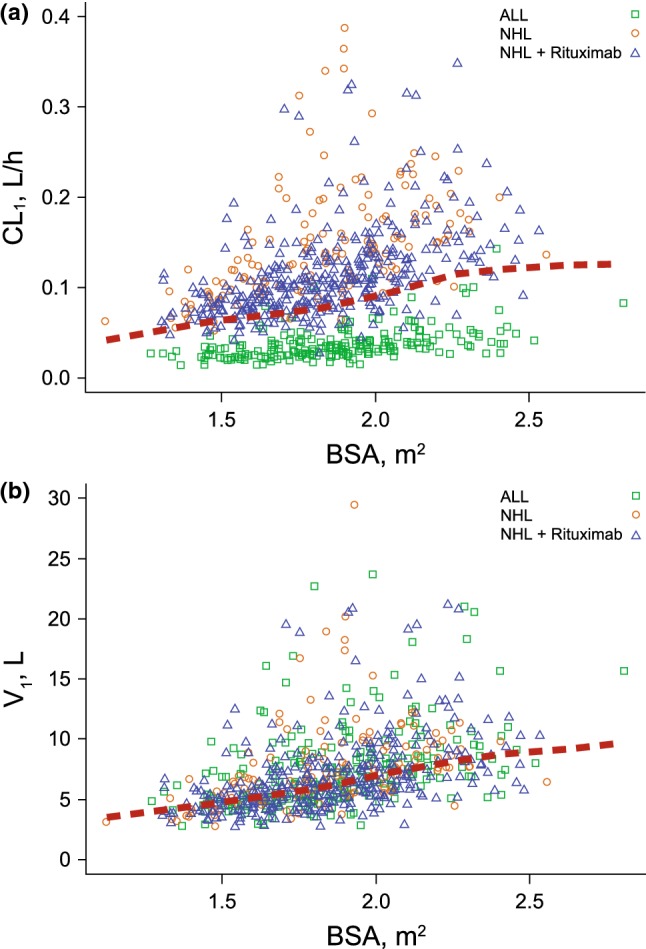
a Linear clearancea or b Volume of distributionb in central compartment versus baseline body surface area by patient type and those receiving rituximab. The red dotted lines are the locally weighted scatterplot smoothing trend line (LOESS). a3 outliers of CL1 > 0.4 L/h were omitted from the plot for better visualization. b1 outlier of V1 > 30 L was omitted from the plot for better visualization