
Fig. 6.
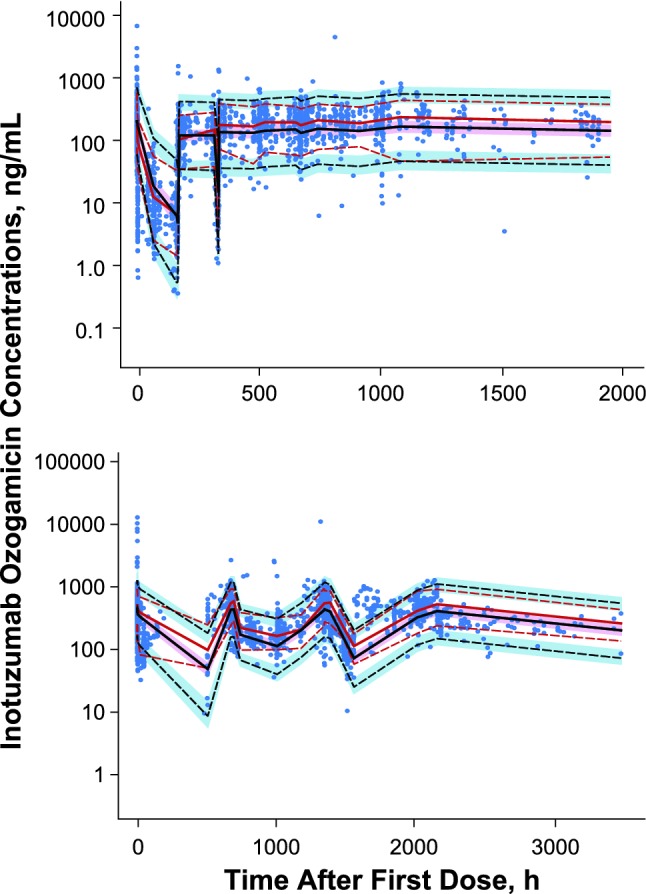
Prediction- and variability-corrected visual predictive check in a patients with ALL and b patients with NHL. The red lines show median (solid) and the 5th and 95th percentiles (dash) of the observed concentrations. The black lines show median (solid) and the 5th and 95th percentiles (dash) of the simulated concentrations, and shaded regions show the 95% CIs on quantities obtained by simulations (N = 1000)