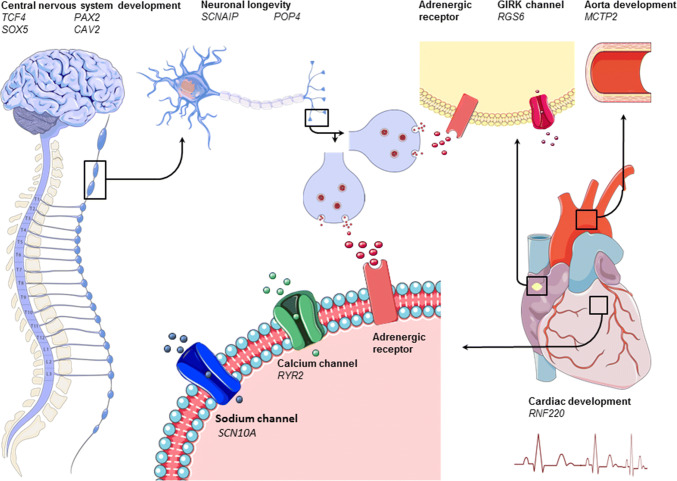
Fig. 1.
Graphical representation of genes (shown in italic) involved in acute heart rate increase during exercise grouped by working mechanism (shown in bold). The left and left upper part of the figure shows the nervous system. The middle upper part zooms in on a peripheral sympathetic neuron and its synapse. The heart is displayed on the right; the upper right of the figure shows the aorta with next to it a pacemaker cell in the cardiac sinus node. In the middle of the figure, below, we zoom in on cardiac tissue and receptors. Adrenergic receptors are shown in red. Sodium, potassium, and calcium channels are shown in red, pink, and green, respectively

