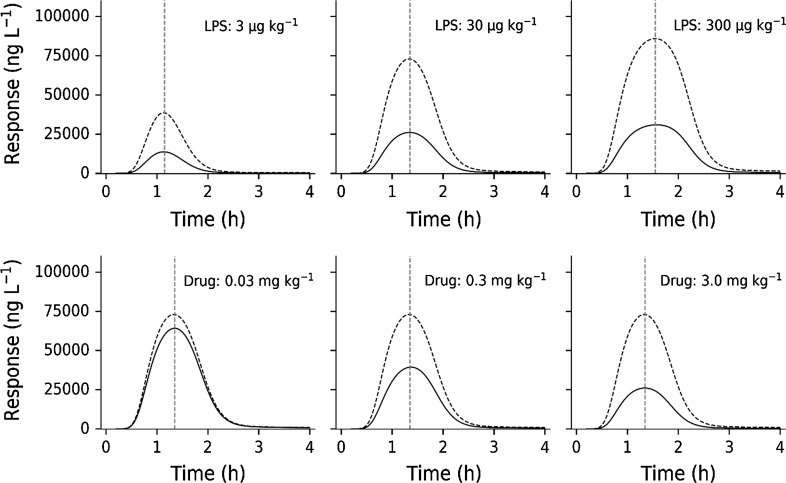
Fig. 12.
Upper row: Impact of different LPS doses (3, 30, 300 µg·kg−1) on TNFα-response given with (solid lines) and without (dashed line) 3 mg·kg−1 of test compound. Bottom row: Impact of a fixed LPS dose (30 μg·kg−1) on TNFα-response with (solid lines) and without (dashed lines) changing test compound doses (0.03, 0.3 and 3.0 mg·kg−1). The red vertical dashed lines show the peak-time locations (Color figure online)

