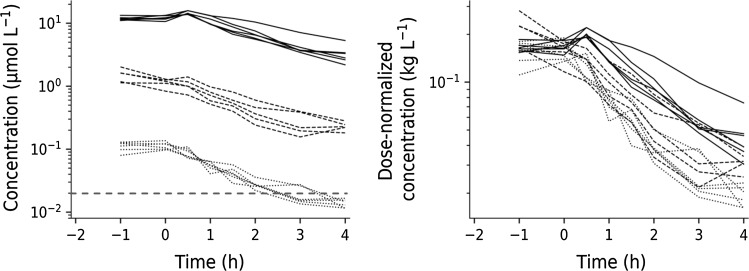
Fig. 4.
Left: semi-logarithmic plot of concentration–time data of test-compound A at three oral doses (0.3, 3 and 30 mg·kg−1, shown as dotted, dashed and solid lines, respectively) in Sprague–Dawley rats from Study 2. Test compound was administered 2 h before intravenous challenge with LPS. The dashed red horizontal line represents the model-predicted test compound potency of about 20 nM. Right: Dose-normalized test compound concentrations plotted versus time

