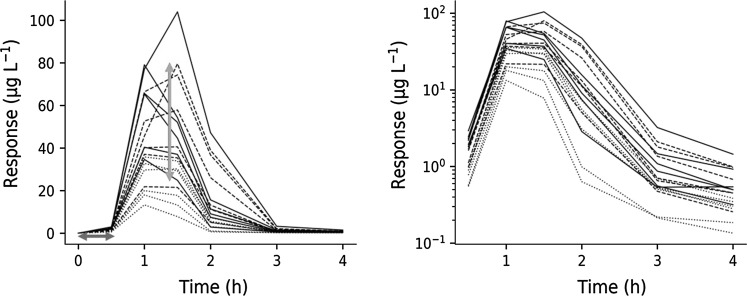
Fig. 5.
Left: TNFα-response time courses at increasing intravenous LPS challenge (3, 30 and 300 μg·kg−1 LPS, shown as dotted, dashed and solid lines, respectively) in Sprague–Dawley rats from Study 1. The blue horizontal double arrow represents the initial time delay in onset of response, and the red vertical double arrow, the 20–80 range in TNFα peak-response of the 30 μg·kg−1 LPS challenge. Right: Semi-logarithmic plot of the same TNFα-response time courses (Color figure online)

