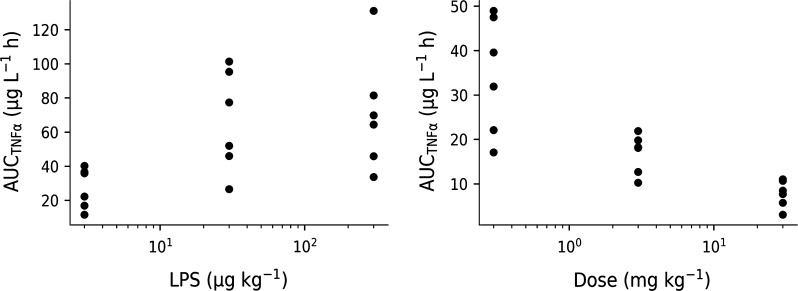
Fig. 6.
Left: Area under the TNFα-response plotted versus increasing LPS challenge doses (3, 30 and 300 μg·kg−1 LPS) from Study 1. Right: Area under the TNFα-response plotted versus increasing oral doses of test compound (0.3, 3 and 30 mg·kg−1 test-compound A) and a fixed intravenous LPS challenge with 30 μg kg−1 from Study 2

