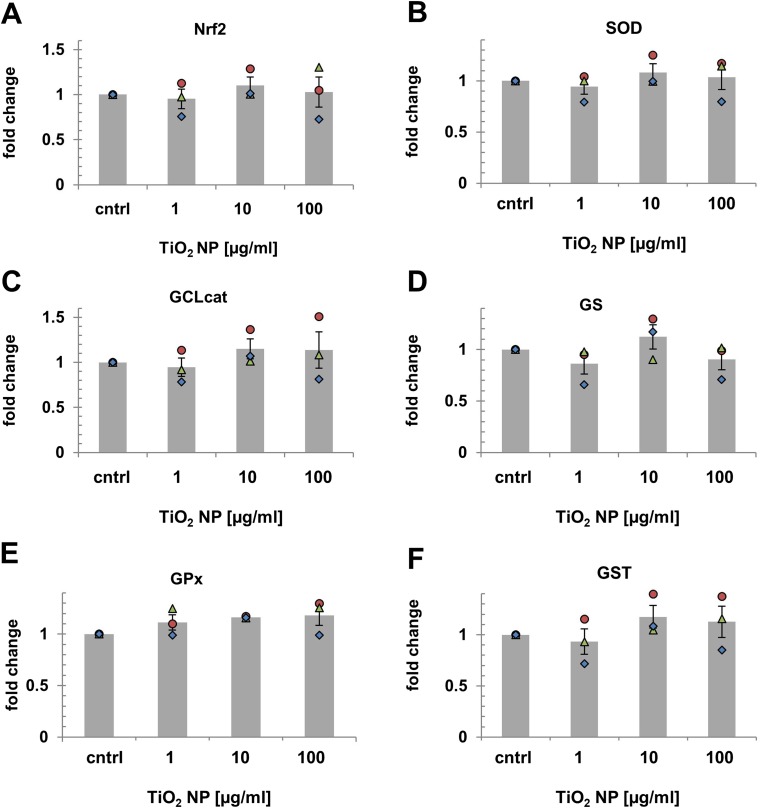
Fig. 6.
Effects on Nrf2/ARE signaling. Relative mRNA expression levels of Nrf2 (a), SOD (b), GCLcat (c), GS (d), GPx (e), and GST (f) displayed as fold change (FC) of control. Markers in each graph (circle, triangle, diamond) show the FC (=2^-ddCq) observed in the first, second, and third independent experimental repetitions (n = 3). Bars and error bars correspond to the FC means and their standard errors. No statistically significant differences (one-way RM ANOVA) were observed

