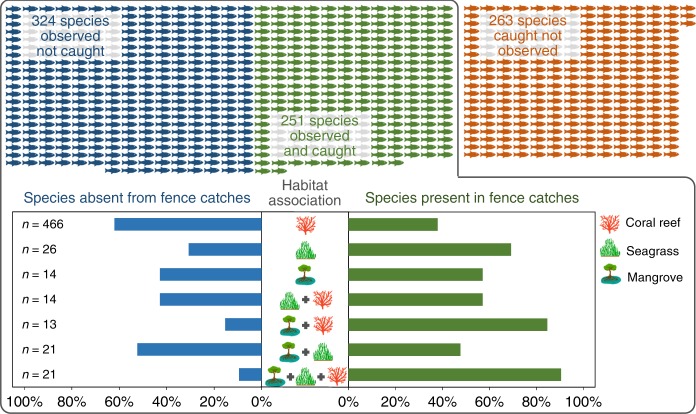
Fig. 4.
Visual representation of the 838 fish species recorded locally, separated by their presence in visual surveys only (blue fish), fish fence catch monitoring only (red fish) or both (green fish). All 575 species recorded in visual surveys (inside 'box) were then allocated habitat associations, based on which visual surveys they were recorded in (coral reef, seagrass, mangrove). For each habitat association, the proportion (%) of species present in (blue bars) and absent from (green bars) fish fence catches are shown, with the total number of species allocated to that habitat association (n). Symbol artwork produced by Olivia Farman, Operation Wallacea

