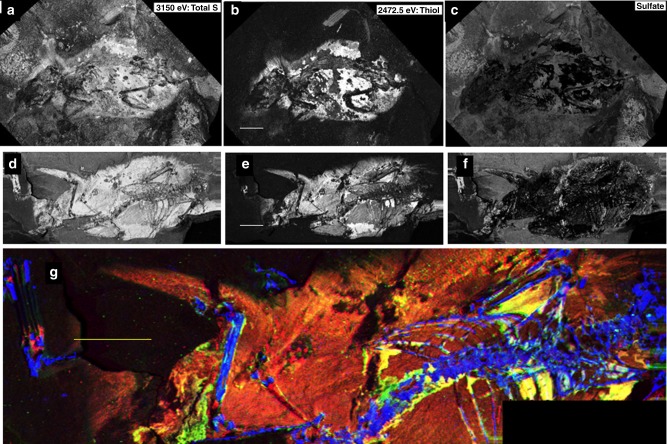
Fig. 2.
X-ray image comparison of “lateral” and “dorsal” fossils. SRS-XRF map comparisons for the A. atavus lateral fossil (GZG.W.20027b: a–c) with the “dorsal” fossil (GZG.W.17393a: d–g). Maps a and d are total sulfur (incident beam energy 3150 eV). b and e show reduced organic species of sulfur (incident beam energy 2472.5 eV). c and f subtract the organic image from the total sulfur map, thus showing only inorganic sulfate. g is a false-color map (blue = P, green = Zn, and red = organic S) for the dorsal fossil comparable to that shown in Fig. 1b for the lateral fossil (scale bars = 1 cm). Bright yellow areas indicate a correlation between Zn and organic sulfur

