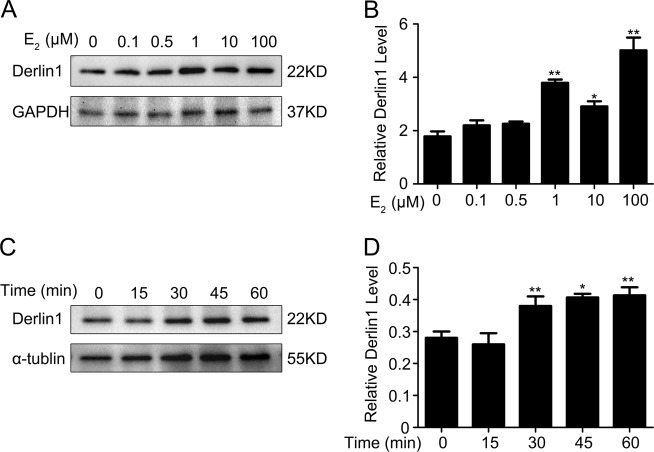
Fig. 5. Estrogen increases the expression of derlin-1 in mpkCCDc14 cells.
a Endogenous derlin-1 expression was dose-dependently increased by E2 treatment in mpkCCDc14 cells, as determined by western blot analysis. b Quantitation of the western blot data for derlin-1 protein shown in A normalized to GAPDH expression. The bars are the means ± SE from three independent experiments. *P < 0.05 and **P < 0.01 compared to the Con group. c E2 induced the protein expression of derlin-1 in mpkCCDc14 cells during a time course, as determined by western blot analysis. d Quantitation of the time-course data for derlin-1 expression shown in (c) normalized to α-tubulin expression. The bars are the means ± SE values from three independent experiments. *P < 0.05 and **P < 0.01 compared to the Con group

