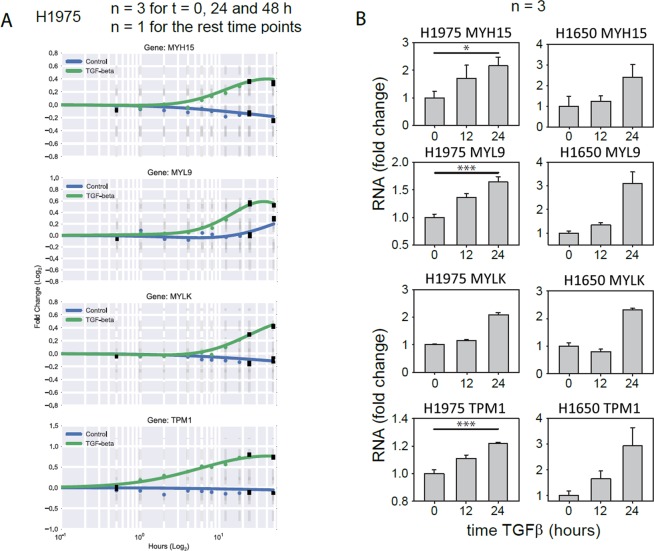
Figure 7.
Dynamic response of MYH15, MYL9, MYLK and TPM1 to TGFβ-stimulation in NSCLC cell lines. (A) Single gene dynamics of candidates genes from the microarray. (B) Validation of the microarray candidate genes with qPCR in H1975 and H1650 cells. Cells were stimulated with 2 ng/ml TGFβ and RNA was extracted at the indicated time points. Gene expression was assessed using qRT-PCR. mRNA expression was normalized to the geometric mean of two housekeeper genes: G6PD and HPRT. *p < 0.05 and ***p < 0.001 significance levels were determined using one-way ANOVA. n indicates the number of independent repetitions.

