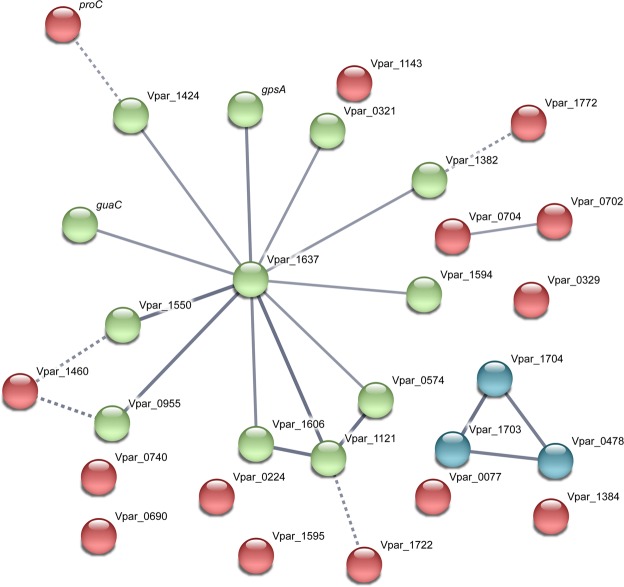
Figure 5.
Analysis of interacting gene networks in the ‘oxidoreductase’ category of the V. parvula differentially expressed gene dataset. Where possible, genes were assigned names based on the V. parvula DSM2008 genome nomenclature by homology searching. The gene list was uploaded to the STRING database, which predicts potential interactions based on factors such as gene environment, protein function or text-mining. The strength of evidence for interactions is indicated by the thickness of edges, with thicker lines indicating stronger interactions. Color coding is based on k-means clustering. The largest network is centered upon Vpar_1637, a predicted glutamate synthase.

