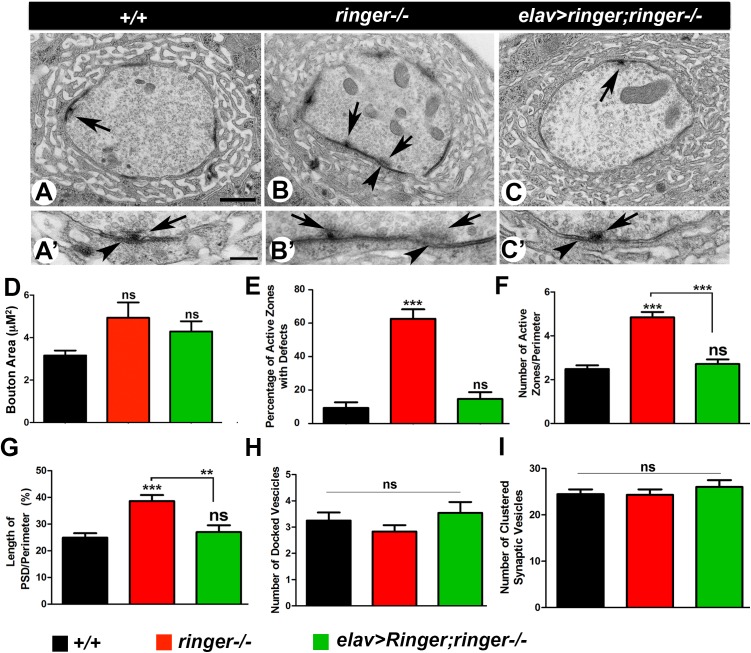
FIGURE 2.
Loss of Ringer show synaptic ultrastructural defects. (A–C′) TEM analysis of cross sections through Type 1b boutons at low magnification (A–C) and high magnification (A′–C′) of wild type (A,A′), ringer–/– (B,B′) and elav-Gal4;UAS-ringer; ringer–/– (C,C′). The AZ T-bars are indicated by arrows and PSD by arrowheads. (D–H) Quantification of total bouton area (D), percentage of AZs with defects (E), number of AZs (F), length of PSD (G), number of docked vesicles (H), and number of clustered vesicles (I) in represented genotypes. n = 50 boutons from five animals of each genotype, Error bars represent mean ± SEM [∗p ≤ 0.05, ∗∗p ≤ 0.01, ∗∗∗p < 0.001, not significant (ns)] (ANOVA). Scale bars: (A–C) = 600 nm and (A′–C′) = 200 nm.

