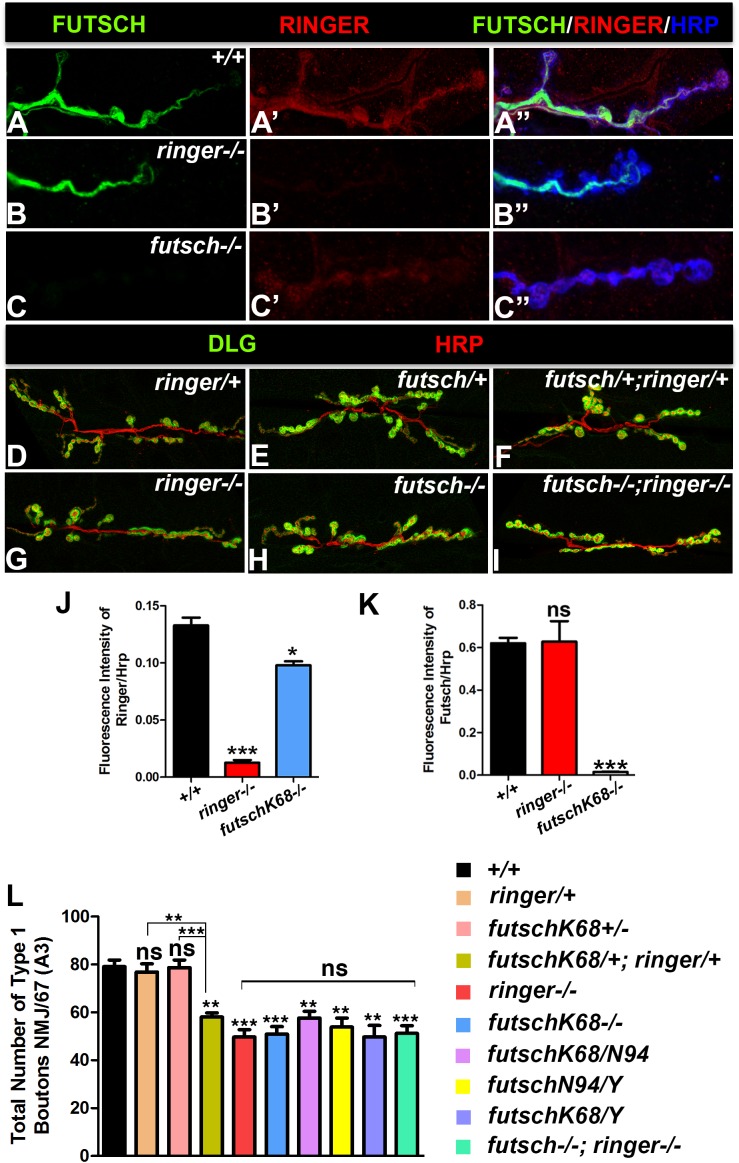
FIGURE 4.
Ringer and Futsch localization and genetic interactions. (A–C″) Confocal images showing localization of Futsch (green, A,A″,B,B″,C,C″), Ringer (red, A′,A″,B′,B″,C′,C″) and Hrp (blue, A″–C″) at NMJ of wild type (A–A″), ringer–/– (B–B″) and futschK68/K68 (C–C″). Representative confocal images showing the synaptic growth in ringer/+ (D), futschK68/+ (E), futschK68/+; ringer/+ (F), ringer–/– (G), futschK68/K68 (H), and futschK68/K68; ringer–/– (I) labeled with Dlg (green) and Hrp (red). Quantification of fluorescence intensity ratio of Ringer/Hrp (J) and Futsch/Hrp (K) and total Type 1 boutons (L) in specified genotypes. n = 15 animals per genotype, Error bars represent mean ± SEM [∗p ≤ 0.05, ∗∗p ≤ 0.01, ∗∗∗p < 0.001, not significant (ns)] (ANOVA).

