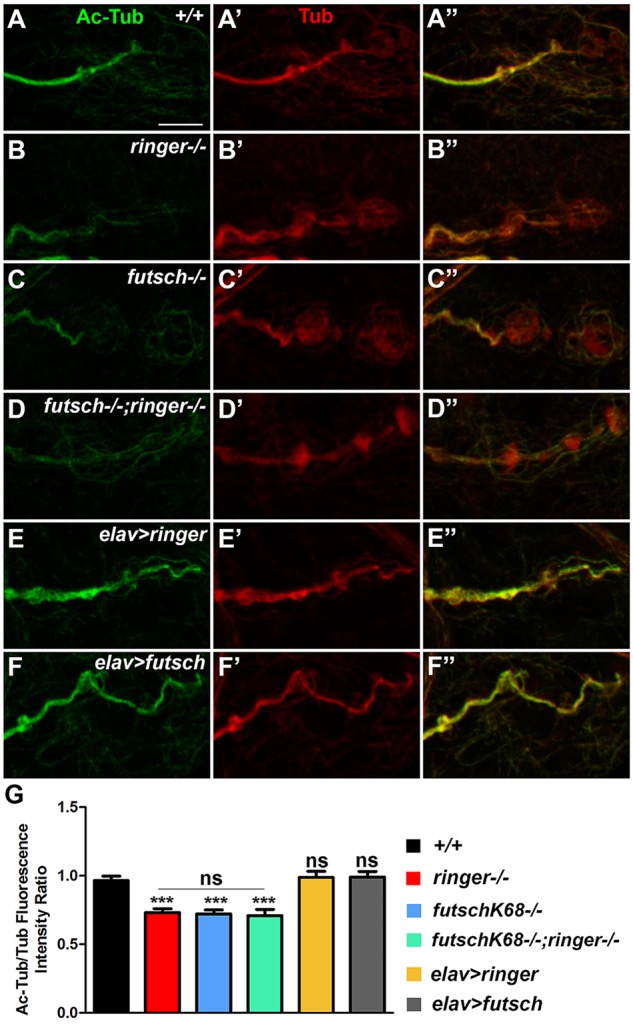
FIGURE 5.

Reduced acetylated-tubulin levels in ringer and futsch mutant NMJs. (A–F″) Representative confocal images of NMJ branches showing Ac-Tub (green, A–F″) and Tub (red, A′–F″) localization in wild type (A–A″), ringer–/– (B–B″), futschK68/K68 (C–C″), futschK68/K68;ringer–/– (D–D″), elav-Gal4; UAS-ringer (E–E″), and elav-Gal4/UAS-Futsch[EP1419] (F–F″). (G) Quantification of the ratio of Ac-Tub/Tub fluorescence intensities in represented genotypes. n = 10 animals (20 NMJ branches analyzed/genotype). Error bars represent mean ± SEM [∗p ≤ 0.05, ∗∗p ≤ 0.01, ∗∗∗p < 0.001, not significant (ns)] (ANOVA). Scale bar: 5 μm.
