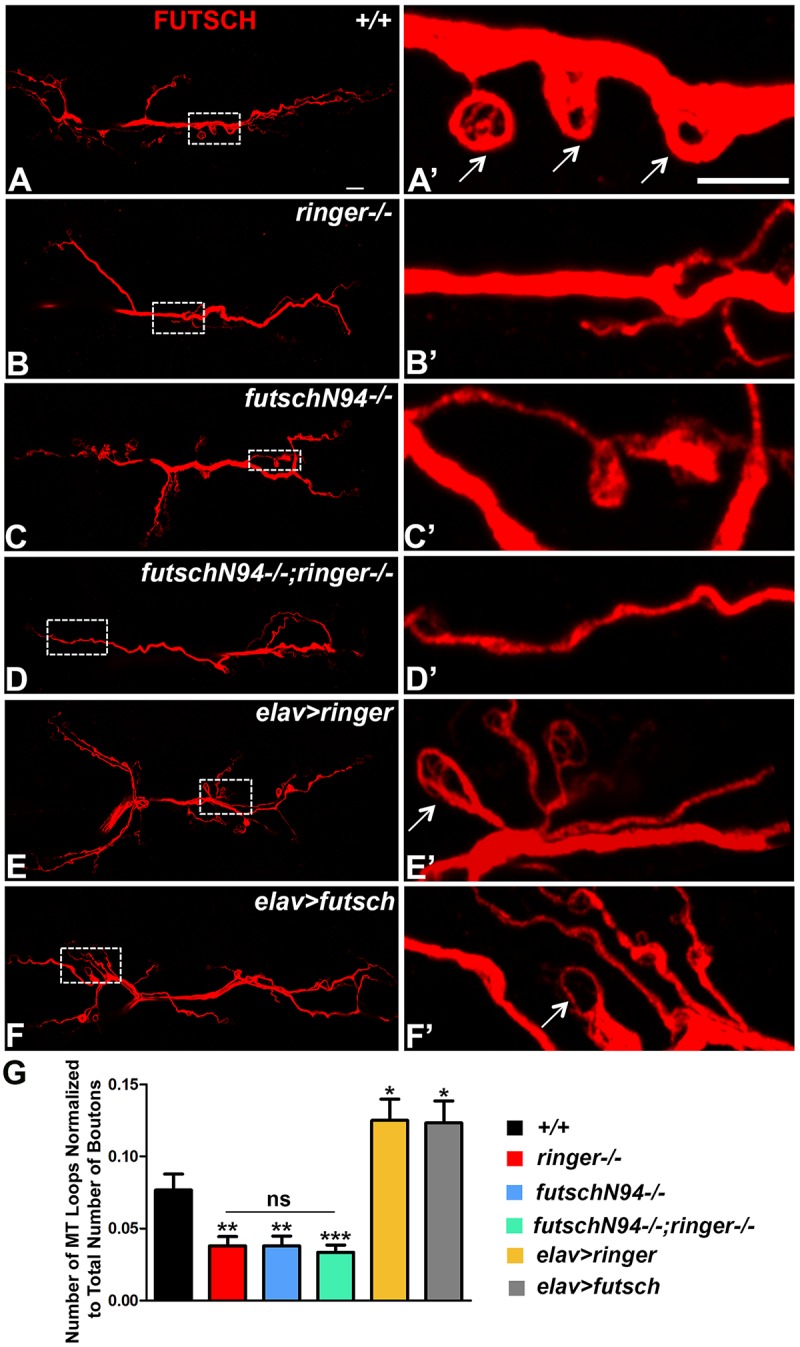
FIGURE 6.

Ringer and Futsch regulate MT loops at NMJ. (A–F) Representative confocal images showing the entire NMJ arbor at low magnification stained with 22C10 in wild type (A), ringer–/– (B), futschN94-/- (C), futschN94-/-; ringer–/– (D), elav-Gal4; UAS-ringer (E), and elav-Gal4/UAS-Futsch[EP1419] (F). (A′–F′) Higher magnification of boxed regions from the corresponding lower magnification (A–F) is depicted in (A′–F′) of respective genotypes. Arrows (A′,E′,F′) highlight the MT loops. (G) Quantification of the number of MT loops/NMJ in represented genotypes. n = 15 animals of each genotype, Error bars represent mean ± SEM [∗p ≤ 0.05, ∗∗p ≤ 0.01, ∗∗∗p < 0.001, not significant (ns)] (ANOVA). Scale bars: (A–F) = 10 μM; (A′–F′) = 5 μM.
