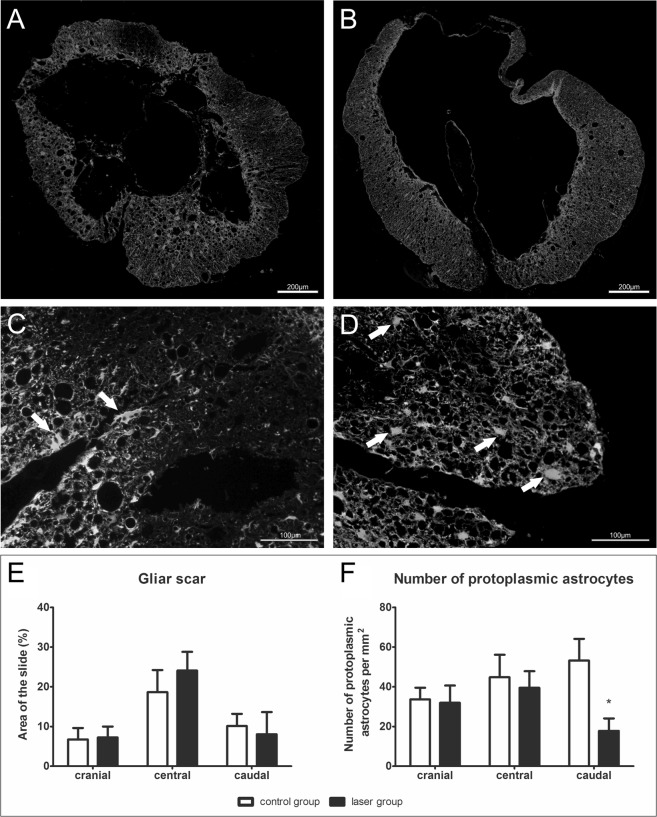
Figure 5.
Glial scar formation. (A–D) Representative images of GFAP staining of cross sections 9 weeks after the SCI for evaluation of glial scar in the cranial part (A,B) and the number of protoplasmic astrocytes in the caudal part (C,D). White arrows show the protoplasmic astrocytes. (A,C) – laser group, (B,D) – control group.(E) Glial scar evaluation in the perilesional area of the spinal cord. Glial scar formation was similar in both groups in cranial (−3 mm, −2 mm), central (−1–+1 mm) and caudal (+2 mm, +3 mm) parts of the lesion center. (F) The number of protoplasmic astrocytes was significantly lower in laser-treated rats caudally (+2 mm, +3 mm) from the lesion center. The values are expressed as mean ± SEM. n = 6 per group. *p < 0.05.

