Figure 1.
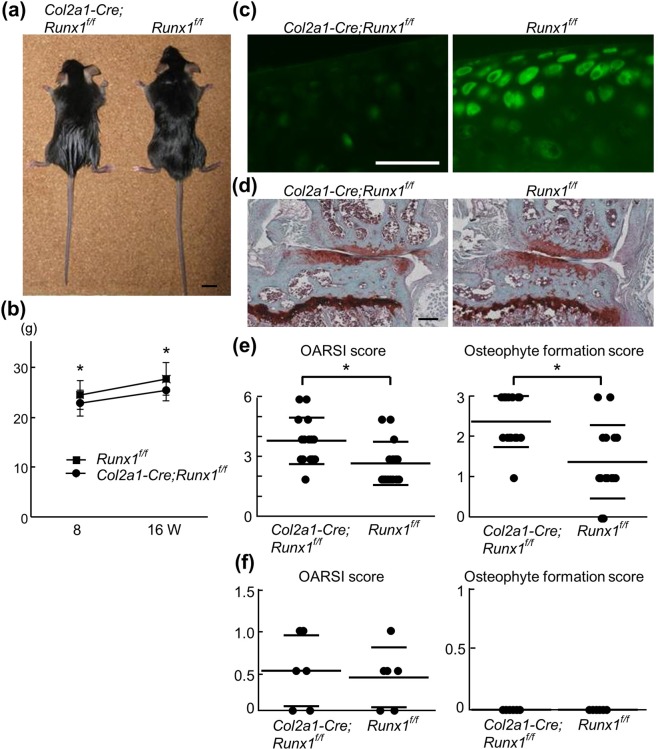
OA development in Col2a1-Cre;Runx1fl/fl and Runx1fl/fl mice. (a) Gross appearance of Col2a1-Cre;Runx1fl/fl and Runx1fl/fl littermates at 8 weeks of age. Scale bars, 10 mm. (b) Total body weight of Col2a1-Cre;Runx1fl/fl and Runx1fl/fl littermates at 8 or 16 weeks of age. Data are expressed as means (symbols) ± SD (error bars) of 15 mice per group. (c) Runx1 immunofluorescence in normal knee cartilage of Col2a1-Cre;Runx1fl/fl and Runx1fl/fl littermates at 16 weeks of age. Scale bars, 50 μm. (d) Safranin O staining of knee joints 8 weeks after OA surgery in Col2a1-Cre;Runx1fl/fl and Runx1fl/fl littermates. Scale bars, 200 μm. (e) Quantification of OA development by Osteoarthritis Research Society International (OARSI) grading system and osteophyte formation score. Data are expressed as means ± SD of 15 mice per group. *P < 0.05 vs. Runx1fl/fl. (f) Quantification of OA development by Osteoarthritis Research Society International (OARSI) grading system and osteophyte formation score in normal knee cartilage of Col2a1-Cre;Runx1fl/fl and Runx1fl/fl littermates at 16 weeks of age. Data are expressed as means ± SD of 6 mice per group.

