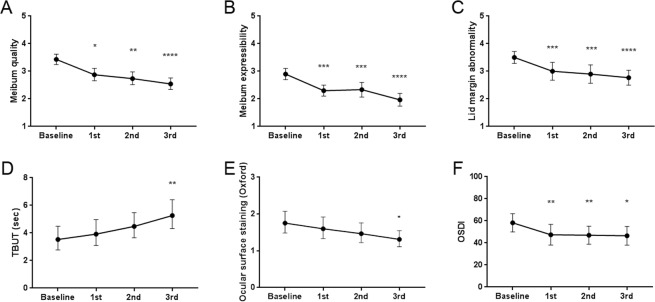
Figure 1.
Change in clinical parameters following each intense pulsed light treatment session in patients with meibomian gland dysfunction. (A) Meibum quality, (B) meibum expressibility, (C) lid margin abnormality, (D) tear film break-up time (TBUT), (E) ocular surface staining score using the Oxford scheme, and (F) Ocular Surface Disease Index (OSDI). *P < 0.05; **P < 0.01; ***P < 0.001; ****P < 0.0001; Friedman test or repeated-measure analysis of variance (ANOVA) with post-hoc multiple comparison analysis, comparing the value after each session to that of the baseline. Individual points and error bars represent the mean (B,C,F) or the geometric mean (A,D,E) and 95% confidence interval.

