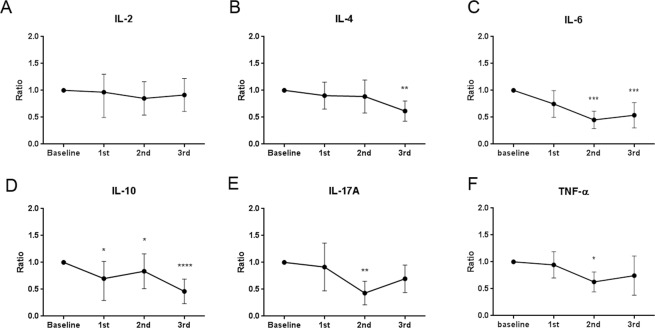
Figure 2.
Change in cytokine profiles following each intense pulsed light (IPL) treatment session as a ratio compared to the baseline. *P < 0.05; **P < 0.01; ***P < 0.001; ****P < 0.0001; analysis of variance (ANOVA) (C,F) or Kruskal-Wallis test (A,B,D,E) with post-hoc analysis, comparing the value after each session to that of the baseline. Individual points and error bars represent the mean (C,F) or the median (A,B,D,E) and 95% confidence interval.

