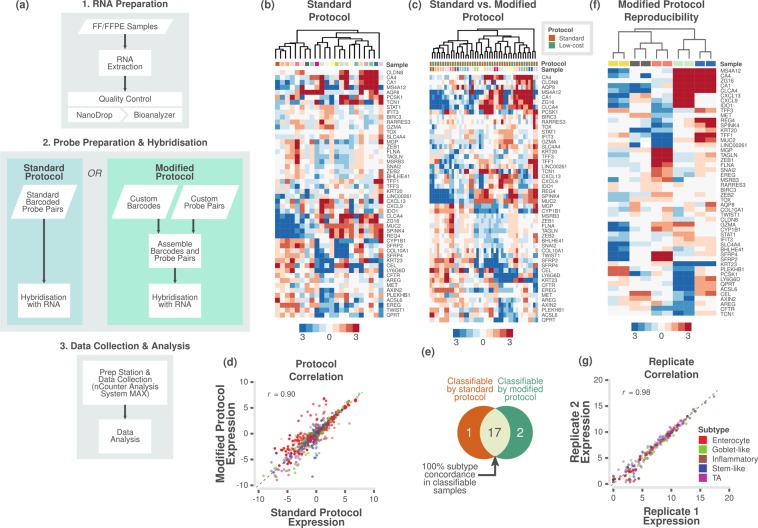
Figure 1.
Assessment of different protocols and reproducibility of reduced gene subtype-based nCounter assay in fresh frozen samples. (a) Flowchart showing the major steps of the NanoCRCA assay protocols. Specifically, this flowchart demonstrates the difference between standard and modified protocols. Though the modified protocol has additional steps, it substantially reduces the cost without significantly increasing the time of the assay. (b,c) Heatmap of expression levels of the selected 48 subtype-specific genes (and 2 additional genes) for 22 fresh frozen samples from the Montpellier and OriGene cohorts as measured on a custom nCounter panel using b) standard protocol and c) both standard and modified protocols (median centred within protocols before clustering). (d) A scatter plot of gene expression measurements for 48 genes in 22 fresh frozen samples between the standard and modified protocols (median centred within protocols before correlation). Each point is coloured by the gene’s weight and subtype (PAM score) in the CRCA-786 centroids. Correlation co-efficient (Pearson’s r) value is shown. (e) Venn diagram indicating the number of samples that were classifiable by the standard and modified protocols, and the concordance between classifiable samples. (f) Heatmap of expression levels of the selected 48 subtype-specific genes (and 2 additional genes) from technical duplicates of 5 samples assayed using modified protocol with a maximum interval of 40 weeks to show the reproducibility of the assay. (g) A scatter plot of gene expression measurements for the 48 genes in 5 technical duplicates. Each point is coloured by the gene’s weight and subtype (PAM score) in the CRCA-786 centroids. Correlation co-efficient (Pearson’s r) value is shown.

