Figure 3.
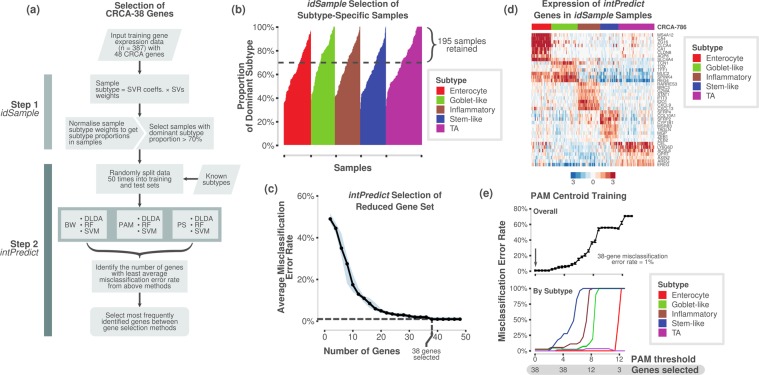
Selection of a robust 38-gene panel. (a) Overview of the process and pipelines used to select a robust gene set for the NanoCRCA assay using in-laboratory developed idSample and intPredict computational tools. (b) Bar plot showing the probability of a sample from our original published dataset (n = 387) belonging to a given subtype, as assessed using idSample. The dotted line represents a cut-off of 70% probability of a single subtype in each sample. (c) A line plot showing median MCR and number of genes as selected using the intPredict pipeline and samples selected in b) (n = 195). The light blue band shows the 95% credible interval of the median MCRs. (d) Heatmap showing the gene expression of the 38-gene panel selected by the intPredict pipeline in (c) in the 195 samples selected by idSample from b). The top bar shows the 786-gene signature-based subtype of the samples. (e) Line plots showing MCR using PAM at different numbers of genes for all the subtypes (upper) and individual subtypes (lower) for 195 samples from b). PS - prediction strength, PAM - prediction analysis of microarrays, BW - between-within group sum of squares ratio, RF - random forest, DLDA - diagonal linear discriminant analysis, SVM - support vector machine, SVR - support vector regression (SVR), and SV – support vector.

